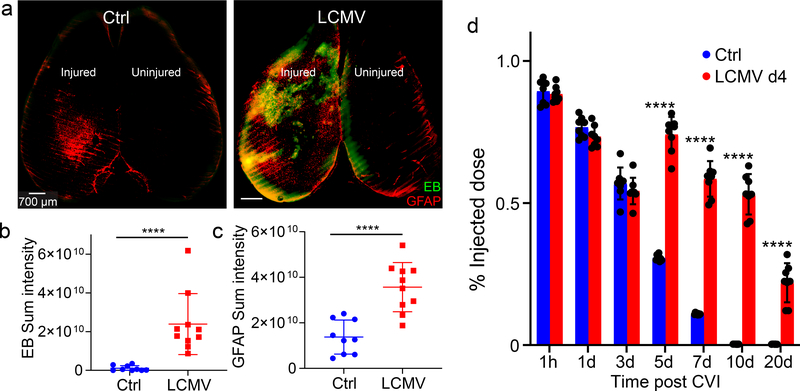
Figure 7. Viral infection and subsequent interferon signaling blocks BBB repair after CVI.
a. Axial confocal images show i.v. injected Evans blue (green, EB) and GFAP+ astrocytes (red) in the superficial neocortex of uninfected (Ctrl) and d4 LCMV-infected B6 mice at day 10 post-CVI. Scale bar, 700 μm. b, c. Dot plots show image-based quantification of Evans blue (B) and GFAP (C) sum intensities. Data represent a compilation of two independent experiments (Ctrl n=9, LCMV n=10). d. Dot plot depicts quantification of fluorescein extravasation in the brains of uninfected (Ctrl) and day 4 LCMV-infected B6 mice at 1h, 1d, 3d, 5d, 7d, 10d and 20d post-CVI. Data represent 2 independent experiments with 8 mice per group. b, c, d. Each symbol represents an individual mouse, and asterisks denote statistical significance. Data are represented as mean ± SD. (****P ≤ 0.0001; b, c Two-tailed Student’s t-test; d Two-way ANOVA/Holm-Sidak test). Source data for b, c, d in Source Data Fig. 7. Statistical analysis in Supplementary Table 5.

