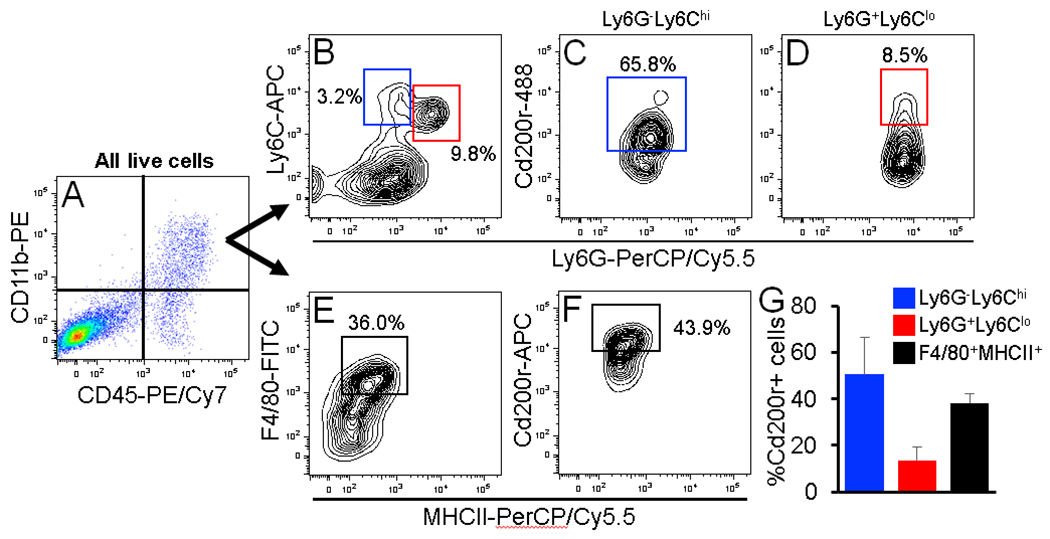
Figure 4. Phenotyping Cd200r+ cSCC-infiltrating cells.

(A-F) Representative FACS dot and contour plots showing the gating strategy for identification of myeloid cell subsets expressing Cd200r. From the total pool of CD45+CD11b+ cSCC-infiltrating cells (A), cells were analyzed for M-MDSC and PMN-MDSC marker panels Ly6G-Ly6Chi and Ly6G+Ly6Clo, respectively (B) or a TAM marker panel F4/80/MHCII (E). Each subset was individually analyzed for Cd200r (C-D,F). (G) Bar graph showing the average percentage of Cd200r+ cells in each infiltrating cell subset (n = 3 cSCCs). All error bars are represented as Standard Deviation.
