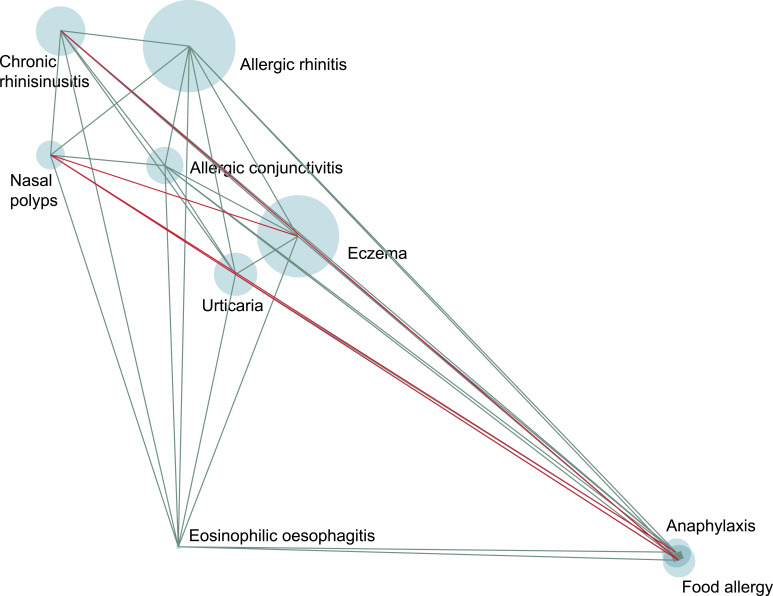
Figure 6.
Clustering of medical service encounters related to type 2 inflammatory diseases among patients with asthma. Size of circles is proportional to the prevalence of the comorbidity. The width of the lines connecting the two comorbidities is proportional to the strength of their association. The color of the lines indicates the direction of association: positive (teal) or negative (red). The position of the comorbidities is based on the rotated eigenvalues from the Principal Component Analyses, and shows the nearness based on co-occurrence frequencies and association strengths and directions.

