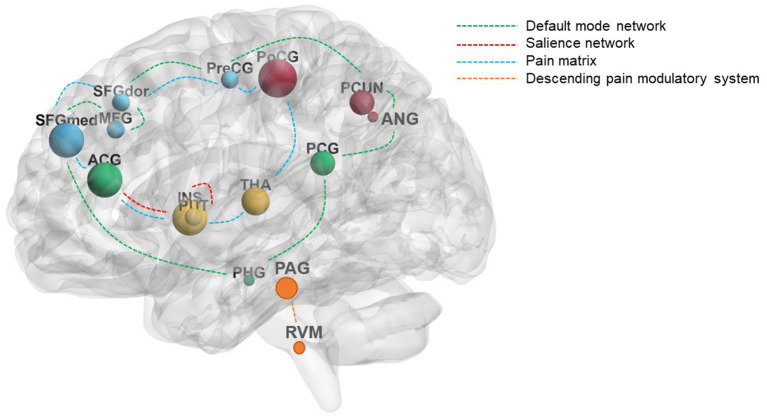
Figure 3.
The main reported brain regions induced by acupuncture in LBP patients. The size of the nodes represents the frequency of the brain regions; the different colors of the dashed lines represent the different modulation pathways of acupuncture. The green dashed lines mainly represent the default mode network, the red dashed lines mainly represent the salience network, the blue dashed lines mainly represent the pain matrix, and the yellow dashed lines mainly represent the descending pain modulatory system. ACG, cingulate gyrus, anterior part; ANG, angular gyrus; INS, insula; LBP, low back pain; MFG, middle frontal gyrus; PAG, periaqueductal gray; PCG, cingulate gyrus, posterior part; PCUN, precuneus; PHG, parahippocampus; PoCG, postcentral gyrus; PreCG, precentral gyrus; PUT, putamen; RVM, rostral ventral medulla; SFGdor, superior frontal gyrus, dorsolateral; SFGmed, superior frontal gyrus, medial; THA, thalamus.

