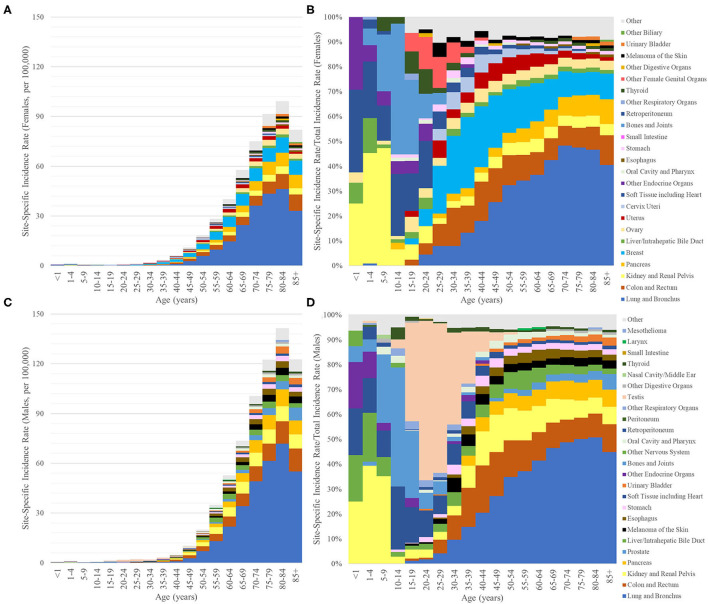
Figure 2.
Bar graphs of the incidence rates per 100,000 of synchronous lung metastasis (y-axis) vs. age at diagnosis (x-axis, 5-year bins) broken down by primary sites of origin, which are indicated by different colors (only the top 10 for ages <15 and top 15 for ages >15). (A,B) Female. (C,D) Male. (A,C) y-axis values represent absolute incidence rates. (B,D) y-axis values represent the percentage of synchronous lung metastasis from one primary site relative to the overall incidence of synchronous lung metastasis from all primary sites for that age group.

