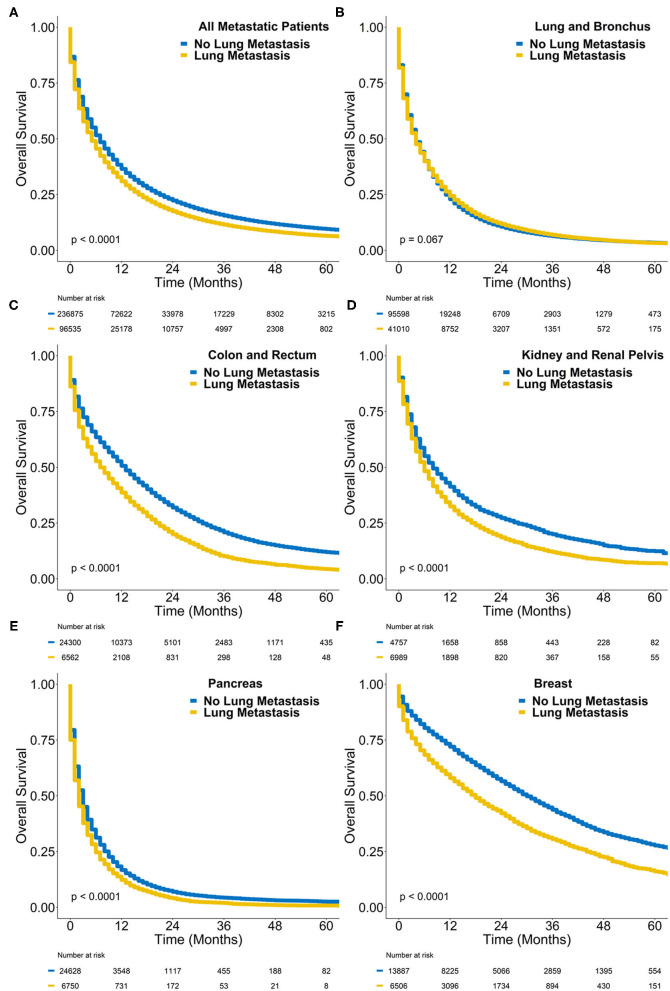
Figure 3.
Kaplan-Meier survival plot of overall survival probability (y-axis) vs. time in months (x-axis) comparing de novo metastatic cases with synchronous lung metastasis (yellow) to those without (blue) in (A) all cases, (B) lung cancer cases, (C) colorectal cancer cases, (D) kidney cancer cases, (E) pancreatic cancer cases, and (F) breast cancer cases. The P-value represents the results of a log-rank test.

