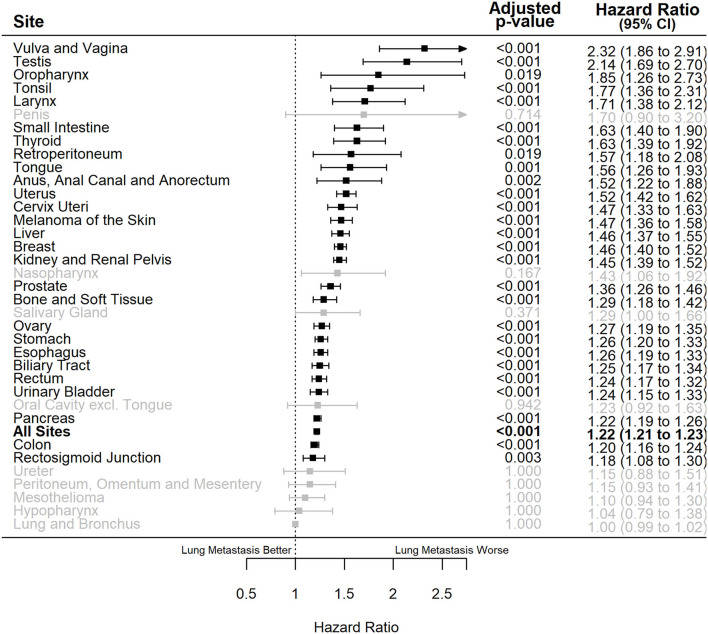
Figure 4.
Forest plot of adjusted hazard ratios of death (x-axis) for de novo metastatic cases with lung metastasis vs. those with only extrapulmonary metastases for different primary sites of origin (y-axis). Bold: the overall effect estimate for all sites, black: statistically significant individual primary sites, gray: non-statistically significant individual primary sites. Adjusted P-values represent those corrected for multiple testing. CI, confidence interval.

