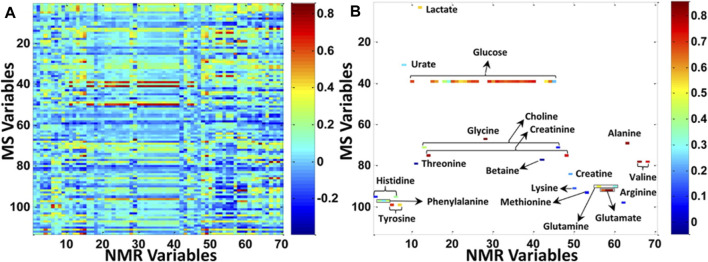
FIGURE 4.
Increasing the metabolic coverage of serum samples from patients suffering from colorectal cancer and polyps, by using both NMR and MS analytical platforms. (A) Correlation between all NMR and MS variables. (B) Correlation between the subset of metabolites (labeled in the figure) that can be detected by both NMR and MS. The X axis provides an index of all NMR variables in the data matrix, and the Y axis provides an index of all MS variables in the data matrix. Reproduced with permission from (Deng et al., 2016).

