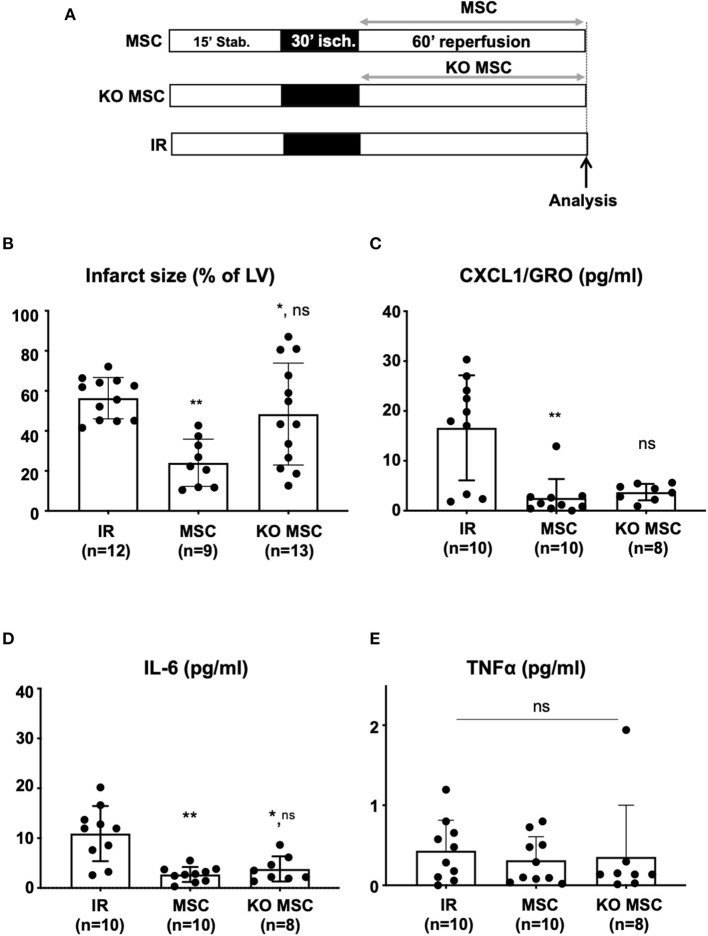
Figure 4.
(A) Isolated hearts perfused ex vivo on the Langendorff system were submitted to perfusion protocol similar to that described in Figure 1A. Reperfusion was achieved with a Tyrode solution alone in the IR group or with a Tyrode solution prepared at a concentration of 5,000 cells/ml with MSC (MSC group) and with KO MSC (KO MSC group). At the end of the protocol, infarct size analysis was performed on the isolated heart (B) and cytokine production was analyzed (C–E) using the Meso Scale Discovery (MSD) V-Plex Plus Proinflammatory Panel 1 (mouse) kit. Statistical analysis was performed using the Kruskal-Wallis test with the Dunn's post test. (B) Scatter plots and bars (mean ± SD) were represented for infarct size (in % of LV) in IR (n = 12), MSC (5,000 cells/ml, n = 9), and KO MSC (5,000 cells/ml, n = 13). Statistical significance is noted ** for p = 0.001 (MSC vs IR), * for p = 0.029 (KO MSC vs. IR), and ns for p = 0.075 (KO MSC vs. MSC). (C–E) Scatter plots with bars (mean ± SD) are presented for quantification of TNFα, CXCL1, and IL-6 within coronary effluents collected at 60 min after the onset of reperfusion from untreated hearts (IR), hearts treated with wild-type MSC (MSC) and MSC deficient for PPARβ/δ (KO MSC) using the Meso Scale Discovery kit. Statistical analysis was performed using the Kruskal-Wallis test. (C) For CXCL1 (pg/ml), ** was noted for p = 0.0017 (MSC vs. IR), ns was noted for p = 0.34 (KO MSC vs. IR) and for p = 0.28 for (KO MSC vs. MSC); (D) For IL-6 (pg/ml), ** was noted for p = 0.0021 (MSC vs. IR), * for p = 0.028 (KO MSC vs. IR), and ns for p > 0.999 (KO MSC vs. MSC); (E) for TNFα (pg/ml), ns was noted for p = 0.60.

