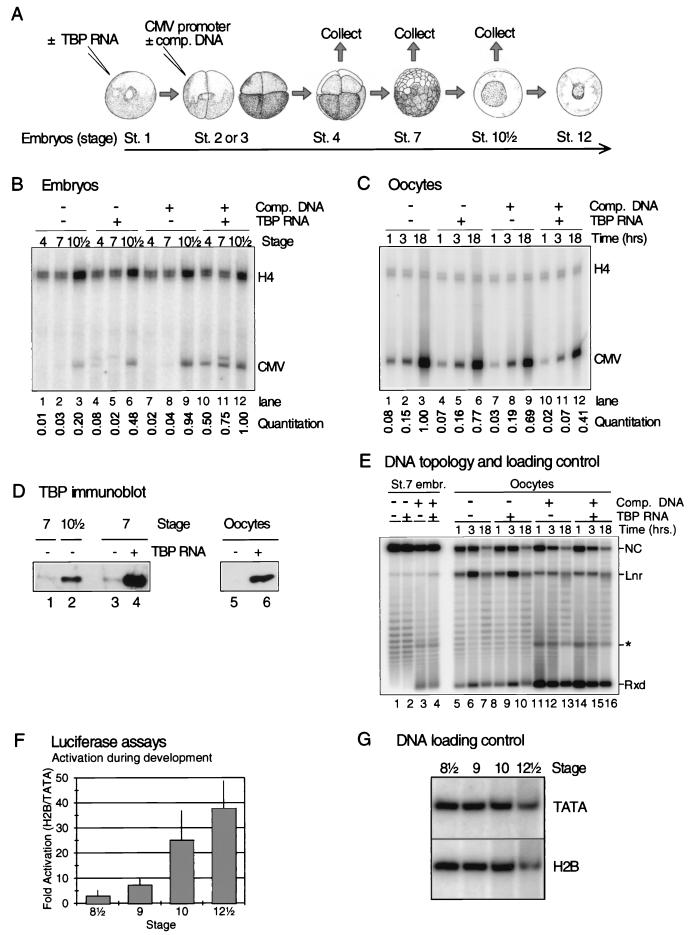
FIG. 4.
Precocious translation of TBP RNA in embryos facilitates transcription before the MBT, but embryos do not fully activate an H2B promoter until well after TBP complementation of the basal transcription machinery. (A) Synthetic TBP RNA (0.5 ng) was injected into stage 1 embryos. Unlike endogenous TBP RNA, synthetic RNA is actively translated before the MBT. After 1 h 0.5 ng of double-stranded pCMV-CAT was injected into one blastomere of two-cell-stage embryos, with or without 20 ng of nonspecific competitor DNA (plasmid without eukaryotic promoter). Embryos were collected for RNA isolation after 1-h, 3-h (25°C), or overnight (14°C) incubation. A similar experiment was performed with oocytes. (B) Primer extension of RNA isolated from embryos subjected to the experiment described in panel A. “CMV” indicates the position of the primer extension product of RNA initiated at the injected CMV promoter; “H4” indicates the position of the primer extension product of endogenous histone H4 RNA used as a primer extension control. A quantitation of the primer extension products from the CMV promoter is shown. The CMV promoter activity was normalized by using the relative level of histone H4 RNA (see Materials and Methods). The results are reproducible between experiments. Two bands are visible for CMV transcription in the lanes containing TBP (lanes 4, 5, and 11); only the lower band represents accurately initiated transcription. The origin of the upper band is unknown. (C) Primer extension of RNA isolated from oocytes subjected to an experiment comparable to the one shown in panel B. At 3 h after injection of TBP RNA into the cytoplasm, 0.5 ng of double-stranded pCMV-CAT was injected into the nucleus, with or without 20 ng of nonspecific competitor DNA (plasmid without eukaryotic promoter). Oocytes were collected for RNA isolation after 1, 3, or 18 h. A quantitation is shown as in panel B. (D) Western blot analysis of TBP protein levels after overexpression in embryos (lanes 3 and 4) or oocytes (lanes 5 and 6). Endogenous TBP levels are shown in lanes 1, 2, and 5 (compare with Fig. 1). (E) Southern blot analysis of a chloroquine gel loaded with DNA isolated from embryos and oocytes subjected to the experiment described in panel A (compare panels B and C). This serves as a loading control (comparable amounts of DNA in all experimental samples) and reveals the DNA topology. The blot was labeled with a CMV-CAT-specific probe. The asterisk shows the position of a cross-hybridizing band corresponding to competitor DNA with a relaxed topology. (F) Activation of the Xenopus H2B promoter as assayed with luciferase assays by using the core promoter (TATA) and full-length promoter (H2B) constructs (0.2 ng of DNA per embryo). Errors ± the standard error of the mean are indicated. The difference between stage 9 and stage 12½ is statistically significant (P < 0.025). (G) DNA loading control of the experiments shown in panel F. This shows that no significant differences exist in extrachromosomal replication of the constructs during embryonic development.

