
FIGURE 3.
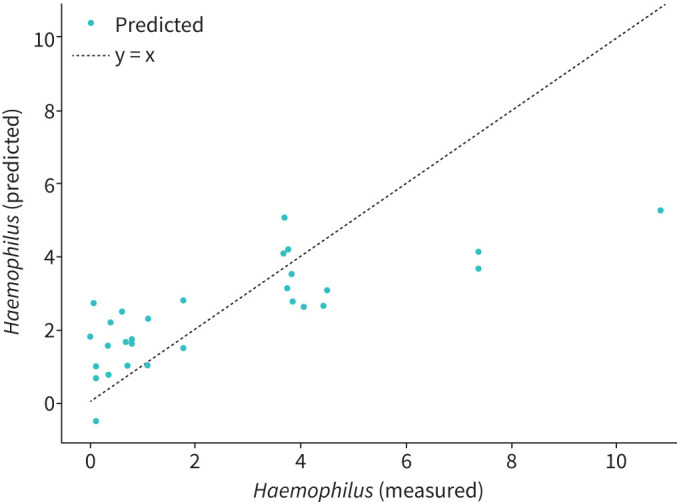
Joint-effects model to evaluate predictive ability of volatile organic compounds (VOCs) for Haemophilus influenzae relative abundance. Plot of predicted values for joint-effects model for VOCs against the measured values of Haemophilus relative abundance. Each point represents the predicted and measured value for a single sample at the screening visit (n=31). The dashed line represents the line for a perfect model.