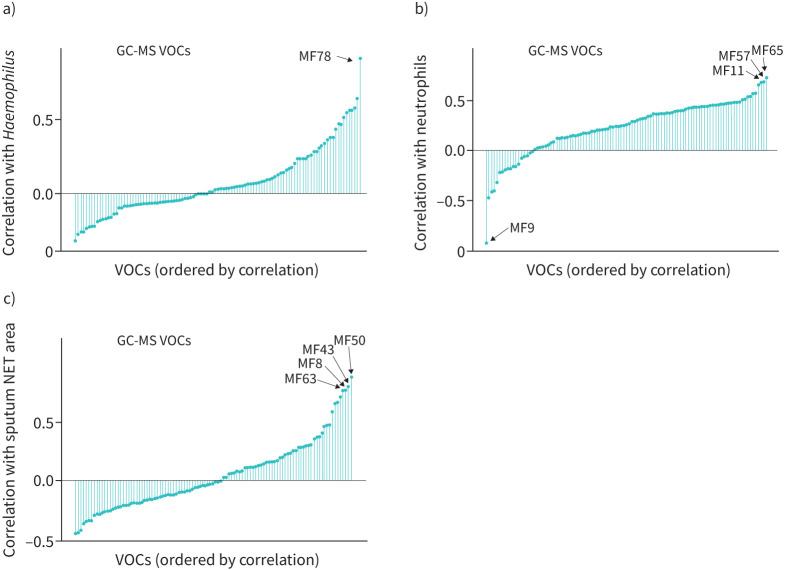
FIGURE 4.
Individual volatile organic compounds (VOCs) ordered by correlation with Haemophilus influenzae relative abundance, percentage sputum neutrophils and sputum neutrophil extracellular traps (NETs) area as measured by gas chromatography mass spectrometry (GC-MS). Individual VOCs or molecular features of interest (MFs), measured by GC-MS, ordered by correlation against a) Haemophilus influenzae relative abundance; b) percentage sputum neutrophils; and c) sputum NET area. MF 78 has strongest correlation with Haemophilus influenzae relative abundance; MFs 65, 57 and 11 with percentage sputum neutrophils; and MFs 50, 43, 8 and 63 with sputum NET area, showing overall lack of overlap between VOCs that may relate to host microbiome, sputum neutrophils and sputum NETs.

