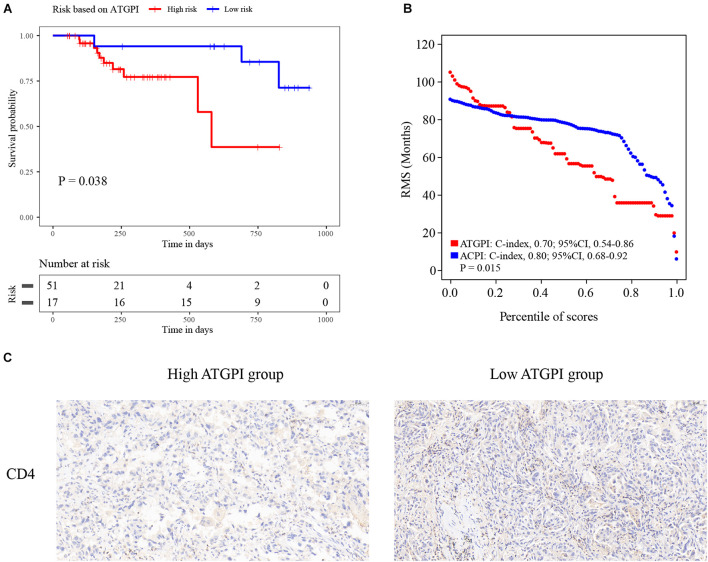
FIGURE 7.
The Kaplan–Meier curves for the autophagy-related gene pair index (ATGPI) and restricted mean survival (RMS) curves for the ATGPI and autophagy clinical prognostic index (ACPI) in the Union hospital (UH) cohort. (A) The Kaplan–Meier curves showed that patients were stratified into different prognostic groups by the ATGPI. (B) The RMS curves revealed that a superior estimation for overall survival was achieved by the ACPI in the UH cohort. (C) Immunohistochemistry (IHC) analysis showed the proportions of tumor-infiltrating CD4+ T cells were higher in the low-ATGPI group.

