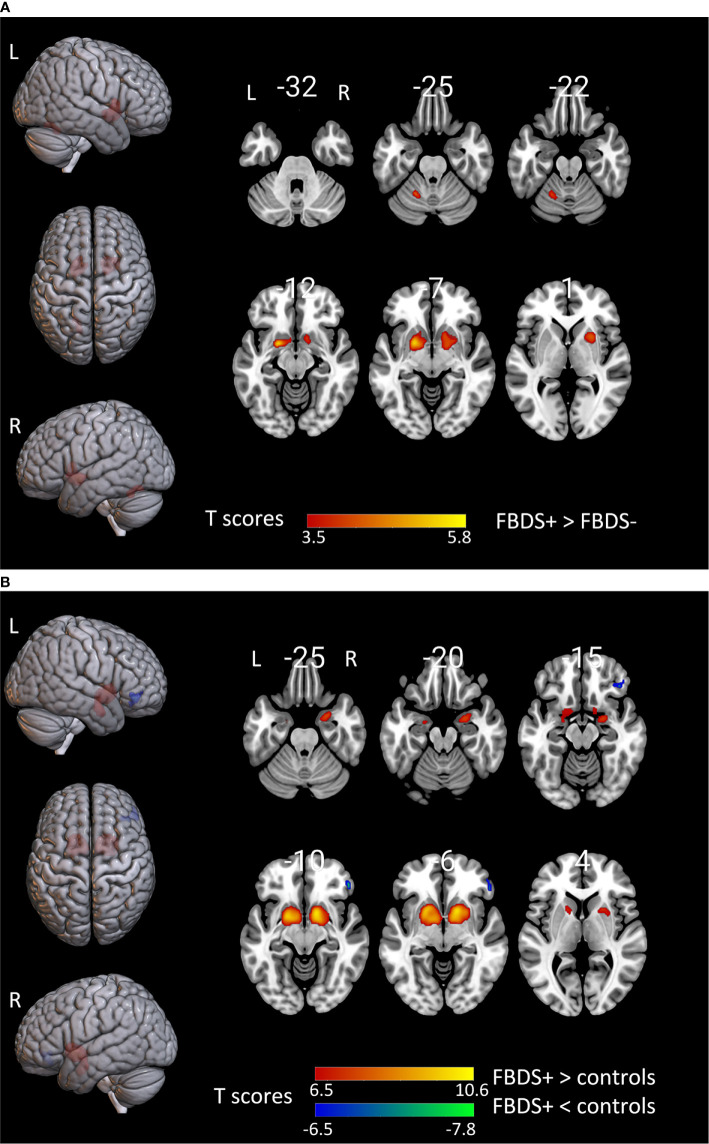
Figure 3.
The comparison of metabolism using the 18F-FDG PET scans of patients with FBDS and those without FBDS and healthy controls by SPM analysis. The T-maps show the hypo-metabolism (cold) and hyper-metabolism (hot colors). The SPM T-maps were projected onto surface, rendering and axial views of the MNI 152 template. The number in each transaxial brain image indicates the distance (mm) from the anterior commissure-posterior commissure plane. (A) Compared to patients without FBDS, the glucose metabolism increased in the bilateral putamen and left cerebellum of patients with FBDS. P = 0.001 without correction. R, right; L, left.(B) Compared to healthy controls, the glucose metabolism increased in the bilateral putamen, and decreased in the right frontal lobe of patients with FBDS. P = 0.001 was corrected. R, right; L, left.

