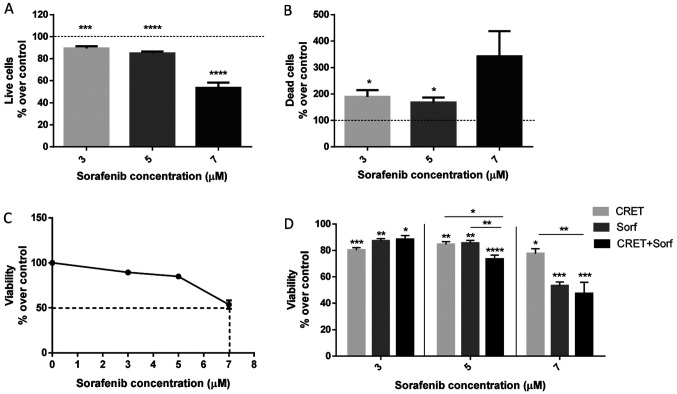
Figure 1.
Effects of treatment with CRET and/or sorafenib on HepG2 cell viability. (A) Live and (B) dead cells after 48 h of treatment with different concentrations of sorafenib. (C) Half-maximal inhibitory concentration determination. (D) Cell viability after treatment with CRET alone (50 µA mm2; 24 h of intermittent exposure + 24 h post-exposure), sorafenib alone (3–7 µM; 48 h) or combined (CRET + sorafenib). Data are presented as the mean ± SD of ≥3 experimental replicates per concentration. The values were normalized to the corresponding controls. *P<0.05, **P<0.01, ***P<0.001 and ****P<0.0001. Data were statistically analyzed via One-way ANOVA followed by Bonferroni post-hoc test. CRET, capacitive-resistive electrothermal therapies; Sorf, sorafenib.

