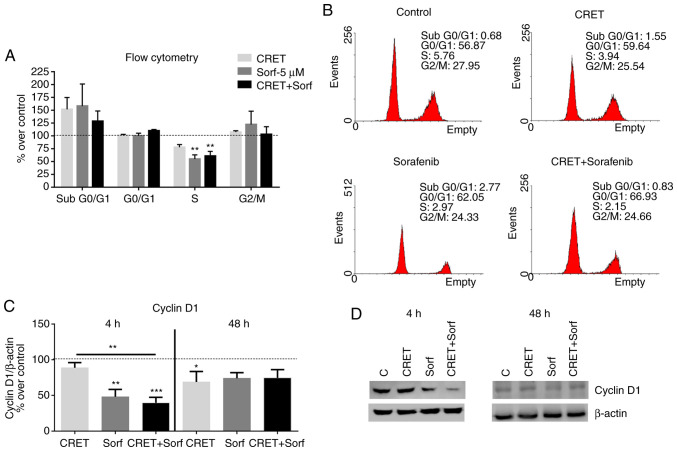
Figure 3.
Effect of CRET and/or sorafenib on apoptosis and the cell cycle. (A) Flow cytometry analysis of samples treated with CRET alone (24 h intermittent exposure + 24 h post-exposure), sorafenib alone (48 h), or in combination. Data are presented as percentages of the mean ± SEM of ≥3 experimental replicates, and are normalized to the respective controls. **P<0.01. (B) Representative flow cytometry histograms of HepG2 cells treated with propidium iodide. (C) Western blotting of cyclin D1 expression after treatment with CRET alone (4 or 24 h intermittent exposure + 24 h post-exposure), sorafenib alone (4 or 48 h) or in combination. Data are presented as the ratio of cyclin D1 to beta-actin (cyclin D1/β-actin). Data are presented as the mean ± SEM of ≥3 experimental replicates. *P<0.05, **P<0.01 and ***P<0.001. Data were statistically analyzed using One-way ANOVA followed by Bonferroni post-hoc test. (D) Representative western blots using β-actin as the loading control. CRET, capacitive-resistive electrothermal therapies; C, control; Sorf, sorafenib.

