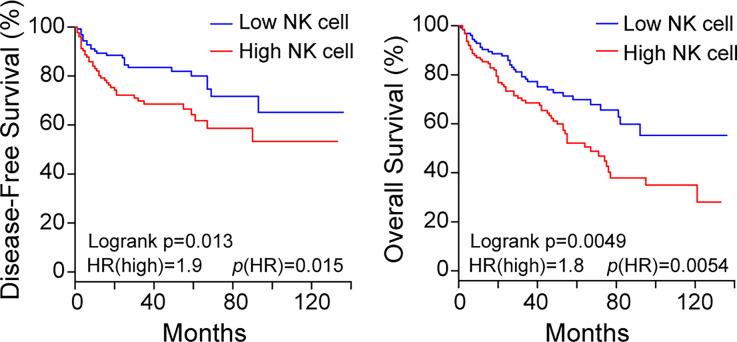
Figure 1.
The presence of a high NK cell infiltration in ccRCC is associated with decreased survival. Kaplan-Meier curves for patients with KIRC (n = 516) from the TCGA database. Disease-free survival (left) and overall survival (right) of patients with high (red line) and low (blue line) NK cell infiltration was established according to the abundance of a gene signature that includes 10 NK cell-associated genes (NCR1, XCL1, XCL2, NCAM1, NCR3, IL18RAP, KIR2DL4, KLRC3, KLRD1 and NCR2, as explained in Materials and Methods). Hazard ratio (HR) for the high NK infiltration and logrank p values are shown in the lower left of each Kaplan-Meier plot. Top and bottom quartiles are shown.

