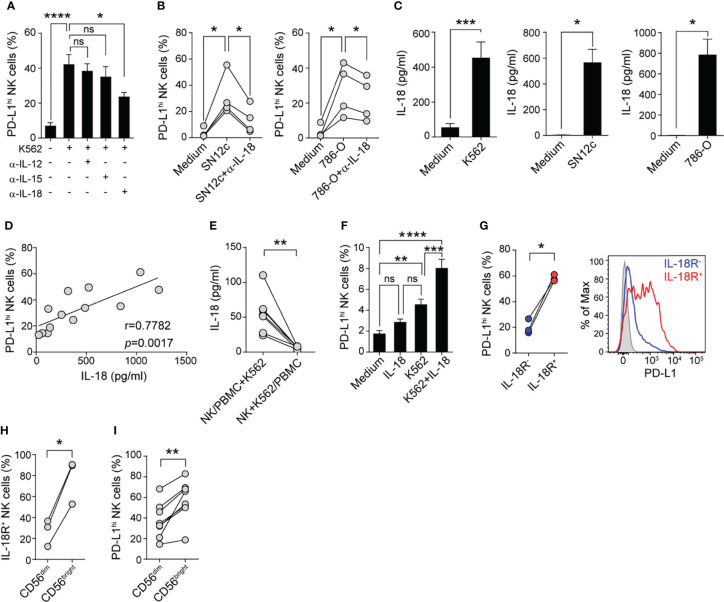
Figure 4.
IL-18 produced during tumor-stimulation of PBMC enhances PD-L1 expression on tumor-experienced NK cells. (A) Frequency of PD-L1hi NK cells after culture of PBMC in the absence (Medium) or in the presence of K562 cells and different cytokine-neutralizing mAb for 48 h, assessed by flow cytometry (n=5). (B) Frequency of PD-L1hi NK cells after culture of PBMC in the absence (Medium) or in the presence of SN12c cells (left) or 786-O cells (right) and in the absence or in the presence of an anti-IL-18-neutralizing mAb for 48 h, assessed by flow cytometry (n=4). (C), IL-18 concentration in supernatants of PBMC cultured in the absence (Medium) or presence of K562 cells (n=13), SN12c cells (n=4) or 786-O cells (n=4), assessed by ELISA. (D) Correlation between the concentration of IL-18 detected in the culture supernatants of PBMC stimulated with K562 cells and the frequency of PD-L1hi NK cells (n=13). (E) IL-18 concentration in supernatants of PBMC cultured in contact with K562 cells and separated from isolated NK cells by Tw (left) or PBMC separated from isolated NK cells and K562 cells by Tw (right), assessed by ELISA (n=7). (F) Frequency of PD-L1hi NK cells after culture of isolated NK cells in the absence (Medium) or in the presence of IL-18, K562 cells or K562 cells and IL-18 (K562+IL-18) for 48 h, assessed by flow cytometry (n=10). (G) Frequency of PD-L1hi cells detected in IL-18Rα+ (red) and IL-18Rα- NK cells (blue) after stimulation of PBMC with K562 cells for 48 h, assessed by flow cytometry (n=3). A representative histogram is shown. (H) Frequency of IL-18Rα+ cells among CD56dim and CD56bright NK cells after culture of PBMC in the presence of K562 cells for 48 h (n=3). (I) Frequency of PD-L1hi cells among CD56dim and CD56bright NK cells after culture of PBMC in the presence of K562 cells for 48 h (n=8). Data represent mean ± SEM. One-way ANOVA with Dunnett´s (A, B) and Tukey´s (F) post hoc test, two-sided Student´s t test (C, E, G–I) and Pearson´s correlation (D). ns, non-significant; *p<0.05, **p<0.01, ***p<0.001, ****p<0.0001.

