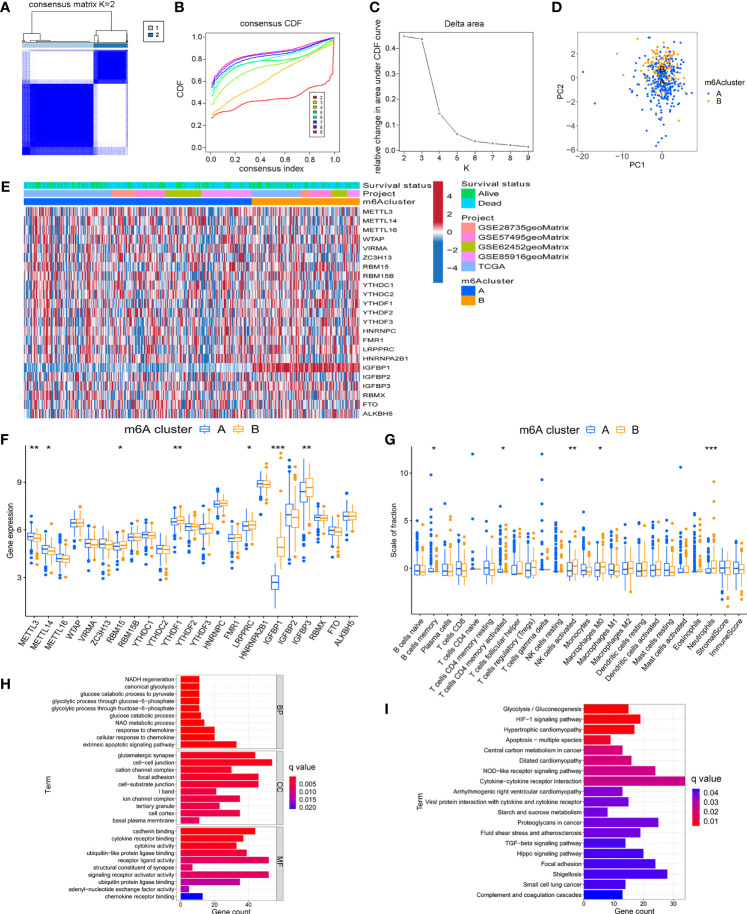
Figure 2.
Identification of m6A methylation modification subtypes. (A) Heat map of sample clustering under k = 2 in 5 independent PC cohorts. (B) Consensus clustering cumulative distribution function (CDF) with the number of subtypes k = 2 to 9. (C) The relative change of the area under the CDF curve of k = 2 to 9. (D) Principal component analysis of the expression profiles of 23 m6A regulators to distinguish two determined m6A clusters. (E) Unsupervised clustering of 23 m6A regulators in two m6A clusters. (F) Differences in the expression of 23 m6A regulators between distinct m6A clusters. (G) TME immune-infiltrating characteristics and transcriptome traits of two m6A clusters. (H) GO enrichment pathway of differentially expressed genes between two m6A clusters. (I) KEGG enrichment pathway of differentially expressed genes between two m6A clusters. ***P < 0.001; **P < 0.01; *P < 0.05.

