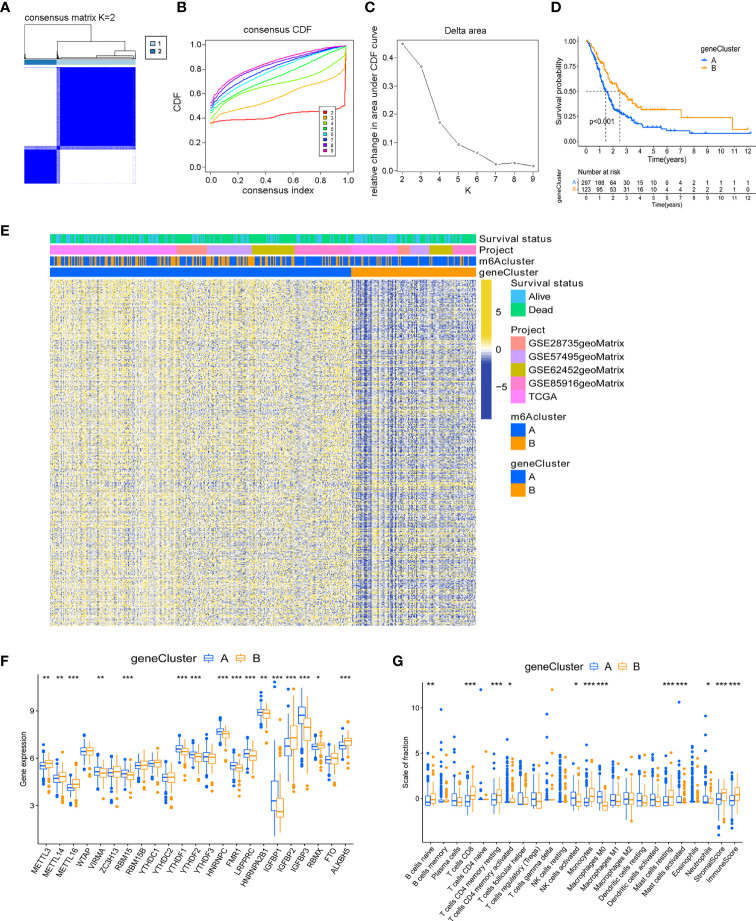
Figure 3.
Identification of m6A-related gene subtypes. (A) Heat map of sample clustering under k = 2 in 5 independent PC cohorts. (B) Consensus clustering cumulative distribution function (CDF) with the number of subtypes k = 2 to 9. (C) The relative change of the area under the CDF curve of k = 2 to 9. (D) Survival analysis of patients in two m6A-related gene clusters. (E) Unsupervised clustering of m6A related signature genes. (F) Differences in the expression of 23 m6A regulators between distinct gene clusters. (G) TME immune-infiltrating characteristics and transcriptome traits of two m6A-related gene clusters. ***P < 0.001; **P < 0.01; *P < 0.05.

