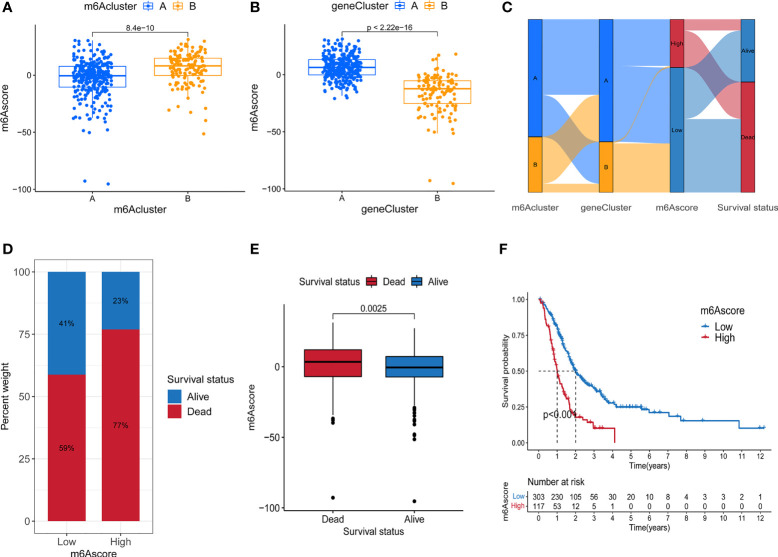
Figure 4.
Construction of m6A score. (A) Difference of m6A score between two m6A methylation modification subtypes. (B) Difference of m6A score between two m6A-related gene subtypes. (C) Alluvial diagram containing m6A cluster, gene cluster, m6A score and survival changes. (D) The proportion of survival and death in high and low m6A score group. (E) Comparison of m6A scores between surviving and dead patients. (F) Survival analysis of high and low m6A score groups.

