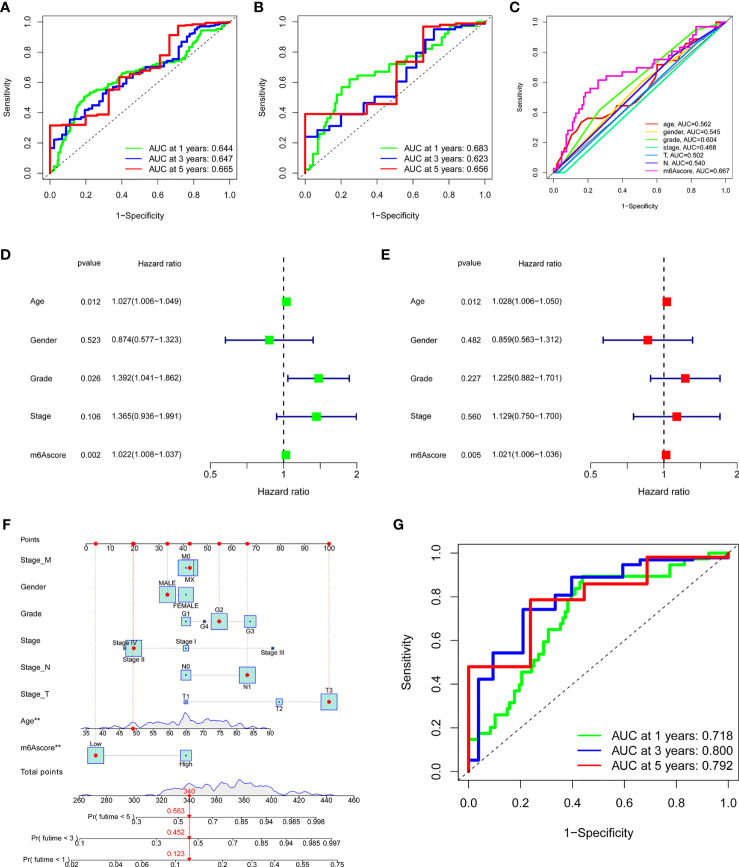
Figure 5.
Validation and application of the m6A score in the clinical evaluation. (A) The AUC values of the 1-year, 3-year, and 5-year ROC curves of m6A score in all samples. (B) The AUC values of the 1-year, 3-year, and 5-year ROC curves of m6A score in the TCGA-PAAD cohort. (C) The comparation of 1-year ROC curve with other clinical characteristics in the TCGA-PAAD cohort. (D) Univariate COX regression analysis showed that age, grade, and m6A score were considered statistically significant. (E) Multivariate Cox regression analysis showed age and m6A score were independent prognostic predictors. (F) The nomogram to predict the probability of 1-year, 3-year, and 5-year survival rate. (G) The AUC values of the 1-year, 3-year, and 5-year ROC curves of the nomogram. ***P < 0.001; **P < 0.01; *P < 0.05.

