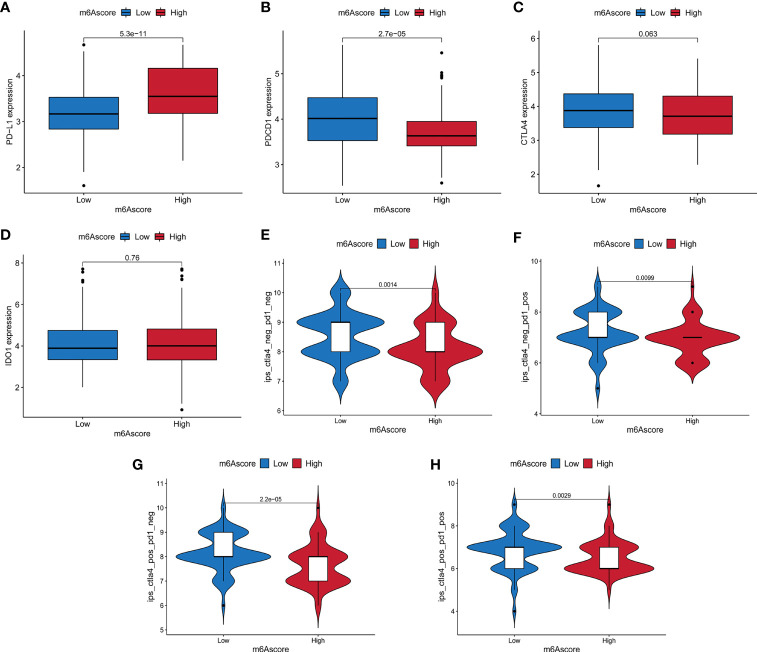
Figure 7.
The relationship between m6A score and immune checkpoint genes and immunotherapy. (A–D) The expression differences of PD-L1, PDCD1, CTLA4 and IDO1 between high and low m6A score groups. (E) The difference of Immunophenoscore (IPS) between high and low m6A score groups with CTLA4 (-)/PD1 (-). (F) The difference of IPS between high and low m6A score groups with CTLA4 (-)/PD1 (+). (G) The difference of IPS between high and low m6A score groups with CTLA4 (+)/PD1 (-). (H) The difference of IPS between high and low m6A score groups with CTLA4 (+)/PD1 (+).

