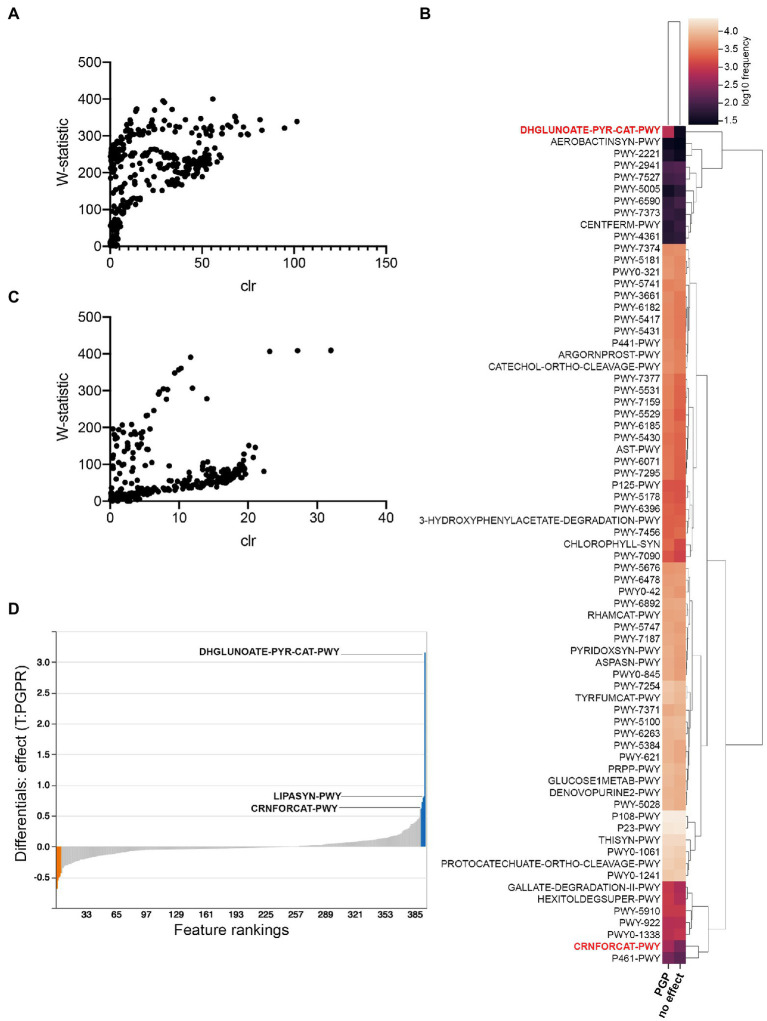
Figure 7.
PICRUSt2 predicted pathway variations in plant-growth-promoting treatments compared to those with no effect. (A) ANCOM analysis in Promix (B) Heatmap of ANCOM output in Promix of relative abundance of pathways between treatments having a plant-growth-promoting effect and no effect (pathways in red have been identified by both ANCOM and Songbird) (C) ANCOM analysis in Canna coco (D) Songbird analysis in Promix. In blue are the top pathways associated with plant growth promotion and in orange the pathways least associated with this feature.

