Figure 4.
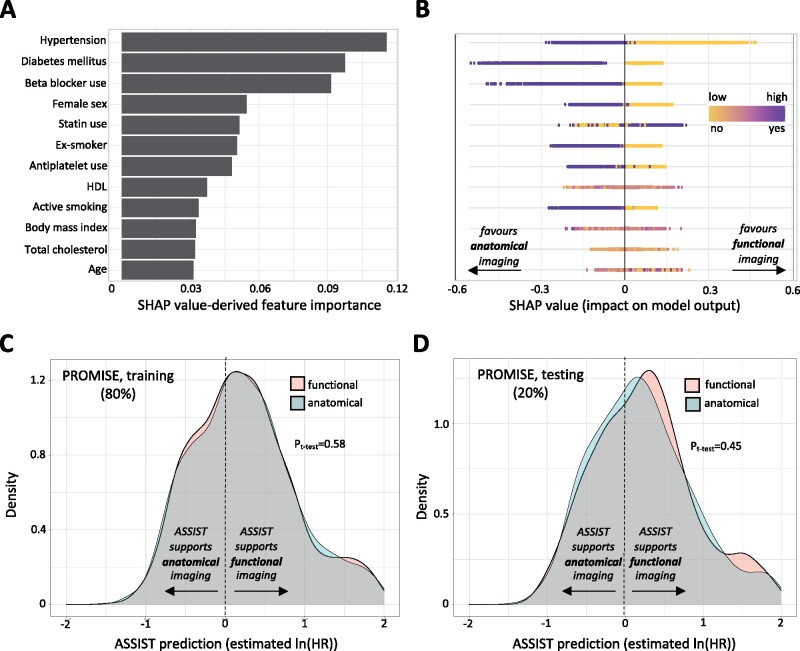
Developing a decision support tool to predict individualized benefit from anatomical vs. functional testing in chest pain investigation. (A) In a randomly selected sample of the PROMISE population, we trained an extreme gradient boosting tree to predict the phenomap-derived individualized risk with anatomical vs. functional testing. We identified the most important input features based on the SHAP values and selected the top 12 predictors (all with feature importance of 0.03 or higher) to create an easy-to-use clinical support tool, named ASSIST. (B) To offer some insight into each variable contribution, we used a SHAP summary plot, in which the y-axis represents the variables in descending order of importance and the x-axis indicates the change in prediction. The gradient colour denotes the original value for that variable (for instance for Booleans such as hypertension or diabetes it only takes two colours, whereas for continuous variables it contains the whole spectrum), with each point representing an individual from the original training set. Negative SHAP values (x-axis) indicate improved outcomes with anatomical imaging (as seen among individuals with hypertension and diabetes) whereas positive values indicate improved outcomes with functional testing. (C and D) Notably, ASSIST predictions were independent of the random assignment to the anatomical or functional testing group in both the training and testing sets of PROMISE. ASSIST, Anatomical vs. Stress teSting decIsion Support Tool; PROMISE, PROspective Multicenter Imaging Study for Evaluation of Chest Pain; SHAP, SHapley Additive exPlanations.

