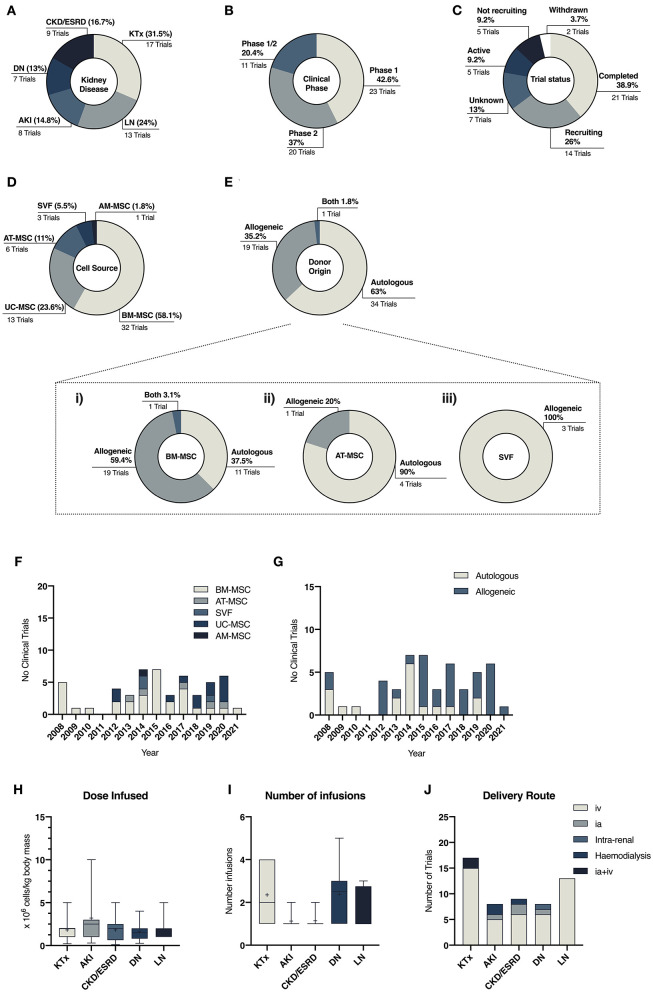
Figure 3.
Descriptive data related to clinical trials in kidney diseases comparing the number of trials per disease (A), clinical phase of the studies (B) and their status (C). (D,E) Illustrate the heterogeneity of cell and donor source across all studies, while (F,G) depicts the change of cell and donor source preferences over the years. (H–J) illustrate protocol differences across different disease settings related to dose of MSC infused (H), frequency of infusions (I) and choice of delivery route (J).

