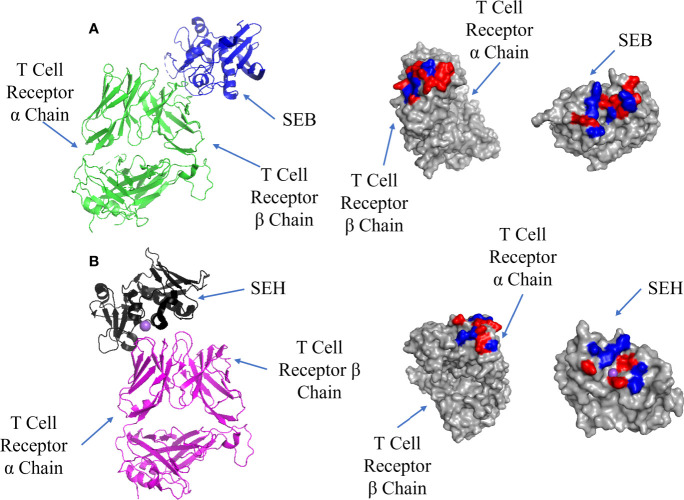
Figure 4.
Binding of SEB and SEH superantigens to -TCRs. (A) Left panel: ribbon plot of SEB (blue) bound to TCR (green) (PDB code: 4C56). Middle panel: TCR showing polar (red) and hydrophobic residues (blue). Right panel: SEB. (B) Left panel: ribbon plot of SEH (black) bound to TCR (purple) (PDB code: 2XN9). Middle panel: TCR. Right panel: SEH.

