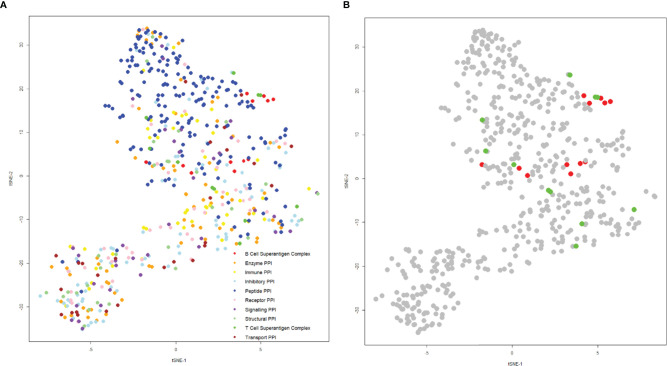
Figure 9.
t-SNE plot of protein-protein interactions highlighting superantigen-antibody complexes. The position of each complex was determined using the following parameters: “Buried Surface Area (A2)”, “Buried Surface Area Hydrophobicity (A2)”, “Number of Interface Residues”, “H-Bonds”, “Salt Bridges”, Category”, “Total Positive Charge at Interface (A2)”, “Total Negative Charge at Interface (A2)” with a perplexity of 30. (A) Distribution of general protein-protein interactions categorized by function (T-cell superantigen complex, B-cell superantigen complex, enzyme PPI, immune PPI, inhibitory PPI, peptide PPI, receptor PPI, signaling PPI, structural PPI, toxin-antitoxin PPI and transport PPI). (B) The same plot as (A), but coloured for T-cell superantigen complexes (green) and B-cell superantigen complexes (red).

