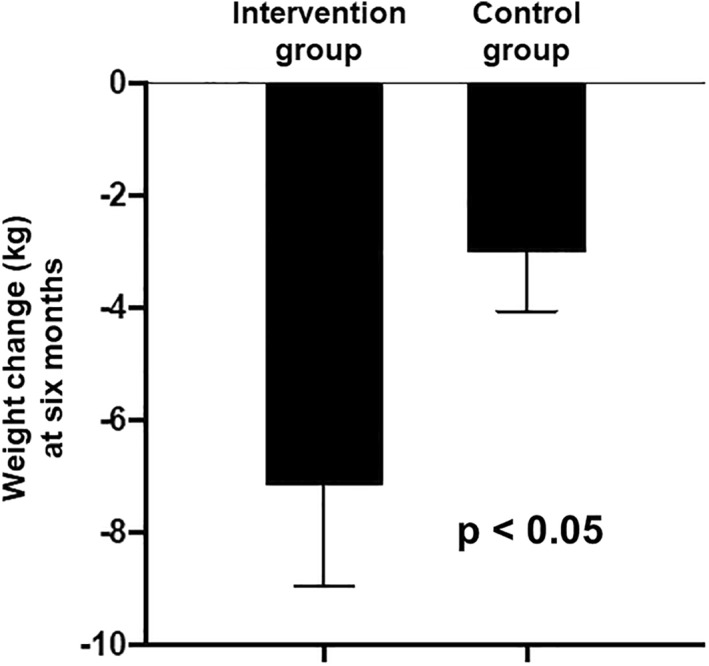
FIGURE 1.

Prespecified primary outcome: comparison of the changes in body weight in kg, from baseline to 6 months, in the intervention group versus the control group. Values are mean ± SE. n = 13 intervention, n = 15 control, p = 0.0488 by the unpaired two‐tailed t‐test
