
FIGURE 5.
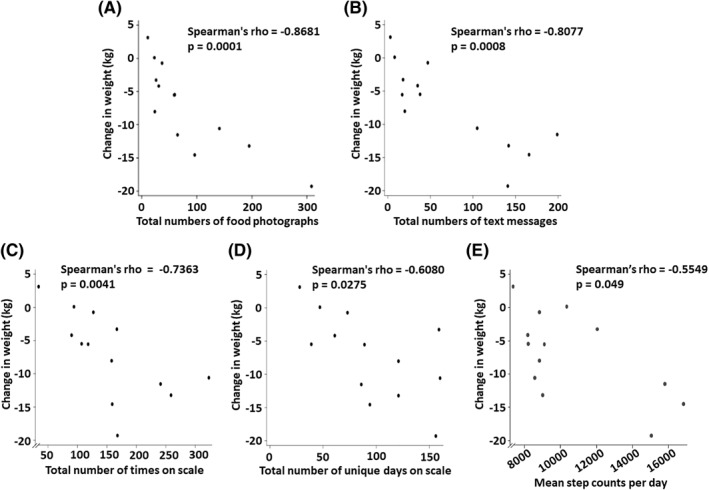
Correlations of each participant's weight change in the intervention group with objective indicators of different aspects of each participant's engagement with the app‐based lifestyle intervention over the 6 months of the study. Shown are correlations of weight change with total number of food photographs sent via the app (“shared”) (A), total number of text messages sent (B), total number of times on the smartscale (C), total number of unique days when the smartscale was used at least once (D), and average daily step counts (E). Displayed are Spearman's rank correlation coefficients (rho) and the corresponding p‐values. In panel A, one participant achieved a weight change of −5.48 kg and shared 60 food photographs, and another participant had a weight change of −5.53 kg and shared 59 food photographs, and so their data points mostly overlap on the graph; these numerical data are given in Table S3