
. 2021 May 4;7(5):583–590. doi: 10.1002/osp4.513
© 2021 The Authors. Obesity Science & Practice published by World Obesity and The Obesity Society and John Wiley & Sons Ltd.
This is an open access article under the terms of the http://creativecommons.org/licenses/by/4.0/ License, which permits use, distribution and reproduction in any medium, provided the original work is properly cited.
FIGURE 1.
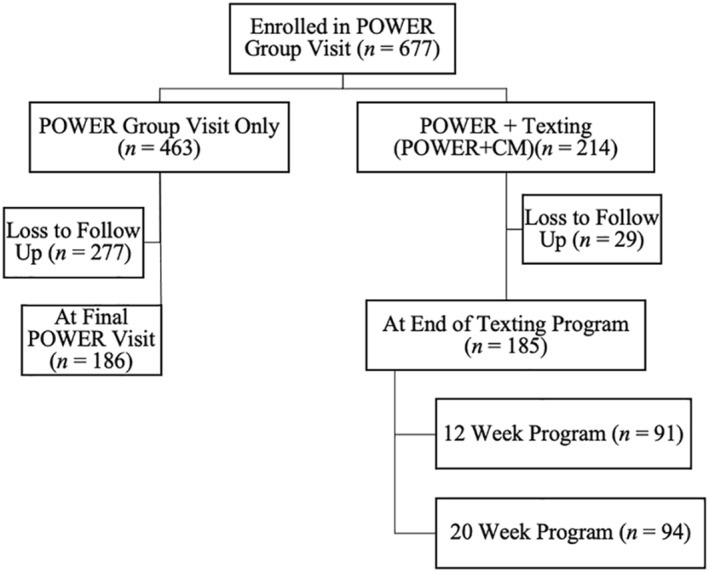
Diagram of participant enrollment starting October 2013