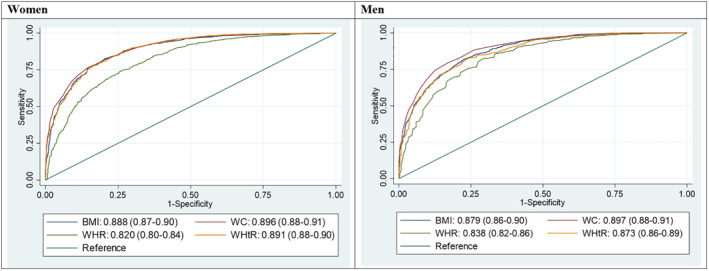
FIGURE 3.

Comparison of VAT with anthropometric variables: The Tromsø Study 2015–2016. *VAT mas cut at median: women ≤832 or >832, men ≤1578 or >1578. BMI, body mass index; VAT, visceral adipose tissue; WC, waist circumference; WHR, waist‐to‐hip ratio; WHtR, waist‐to‐height ratio
