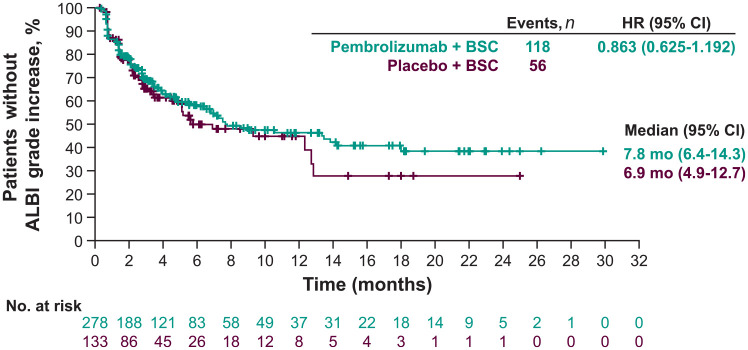
Figure 1.
Kaplan–Meier estimates of time to ALBI grade increase.a,b
aTime to ALBI grade increase was defined as the time from baseline ALBI measurement to the first postbaseline ALBI measurement that is ⩾1 grade higher than baseline ALBI grade.
bData are reported for the as-treated population (n = 411).
ALBI, albumin/bilirubin; BSC, best supportive care; CI, confidence interval; HR, hazard ratio; mo, months.

