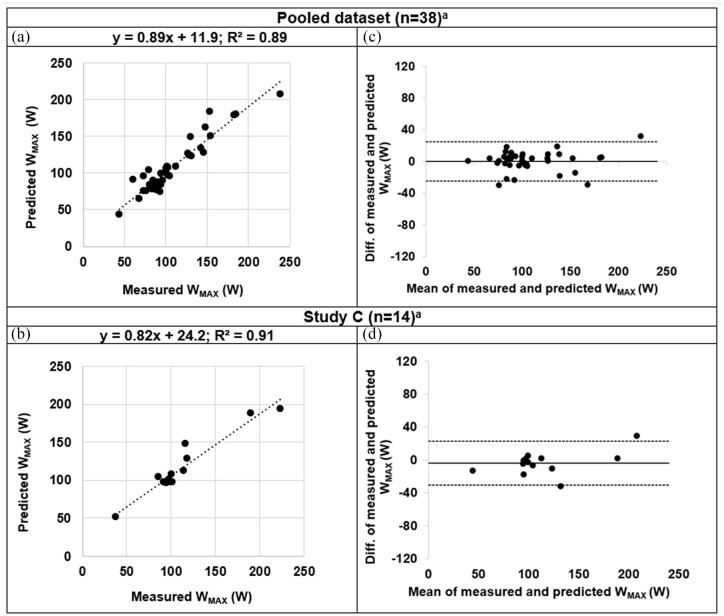
Figure 2.
Correlation plots (a and b) and Bland–Altman graphs (c and d) of predicted WMAX versus measured WMAX: predicted value from the new prediction algorithm was used in the pooled dataset (in a and c) and in study C (b and d). (a and b) Dotted line is line of identity. (c and d) Solid line shows the mean difference. Dotted lines show the limits of agreement, defined as the mean difference ± 1.96 SD of differences.
DLCO, diffusing capacity for carbon monoxide; FEV1, forced expiratory volume in 1 s; SD, standard deviation.
aIncluded variables: DLCO, FEV1, sex, age and height.

