FIGURE 6.

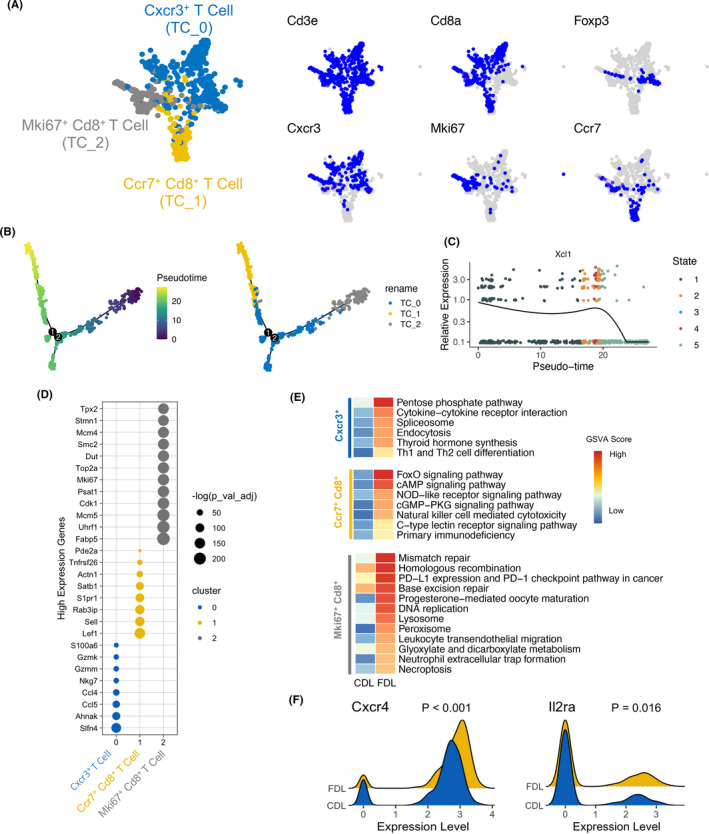
Characteristics and relationships of T‐cell subsets. (A) t‐SNE plot of T cells by clusters (left) and expression patterns of selected markers (right). Blue indicates high expression and grey indicates low or no expression. (B) Trajectory of all clusters of T cell along pseudotime in a two‐dimensional state‐space defined by Monocle2. Each point corresponds to a single cell, and each colour represents a T‐cell cluster. (C) Two‐dimensional plot showing the dynamic expression of XCL1 during the T‐cell transitions along the pseudotime. (D) Dot plots showing the expression of marker genes in each subset of T cells. (E) Significant KEGG pathways enriched by up‐regulated DEGs between CDL and FDL in each subset of T cells. (F) The expression of CXCR4 and IL2RAwas indicated in ridge plot. CDL, control donor liver; FDL, fatty donor liver
