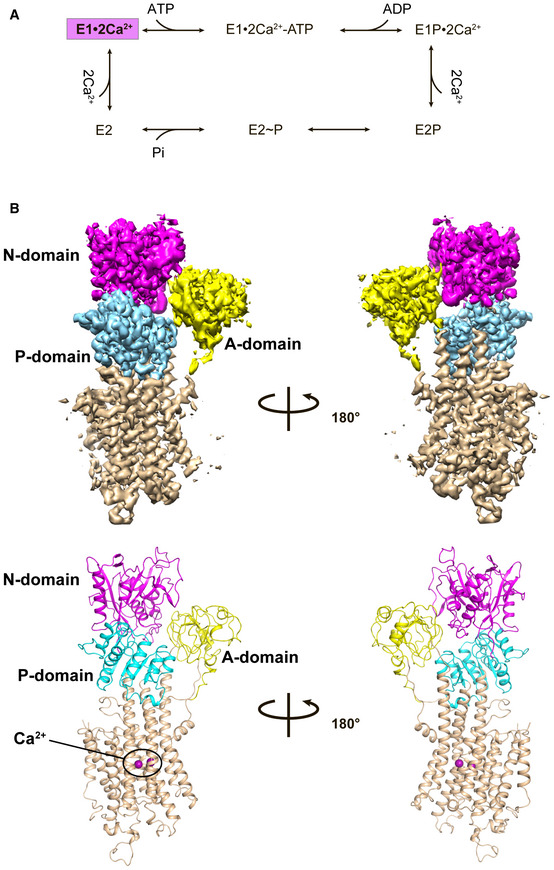
Figure 1. Cryo‐EM structure of SERCA2b WT in the E1∙2Ca2+ state.

- Catalytic cycle for SERCA to transport Ca2+ from the cytosol to the ER lumen through ATP hydrolysis. The intermediate state of which cryo‐EM structures have been determined in this work is colored magenta.
- Cryo‐EM map of SERCA2b WT in the E1∙2Ca2+ state (upper) and its cartoon representation (lower). The A, N, and P domains and transmembrane helices (TM1−TM11) are colored yellow, magenta, cyan, and wheat, respectively.
