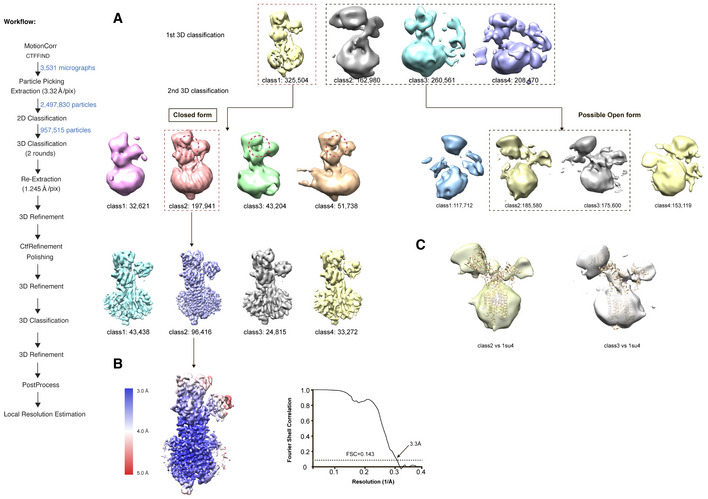
Figure EV1. Workflow of data processing for cryo‐EM single‐particle analysis and local resolution analysis of SERCA2b in the E1∙2Ca2+ state.

- Multiple classes of density map were generated after the first round of 3D classification, which were divided into two classes during the second round of 3D classification. A workflow of data processing for the cryo‐EM single‐particle analysis is shown on the left.
- Local resolution estimation of the “closed‐form” cryo‐EM map of SERCA2b in the E1∙2Ca2+ state. The panel on the right shows the FSC curve for post‐processing of SERCA2b WT in the E1∙2Ca2+ state.
- Superposition of the crystal structure of SERCA1a in the E1∙2Ca2+ state (PDB ID: 1SU4) onto the present “possible‐open‐form” class 2 and class 3 cryo‐EM maps.
