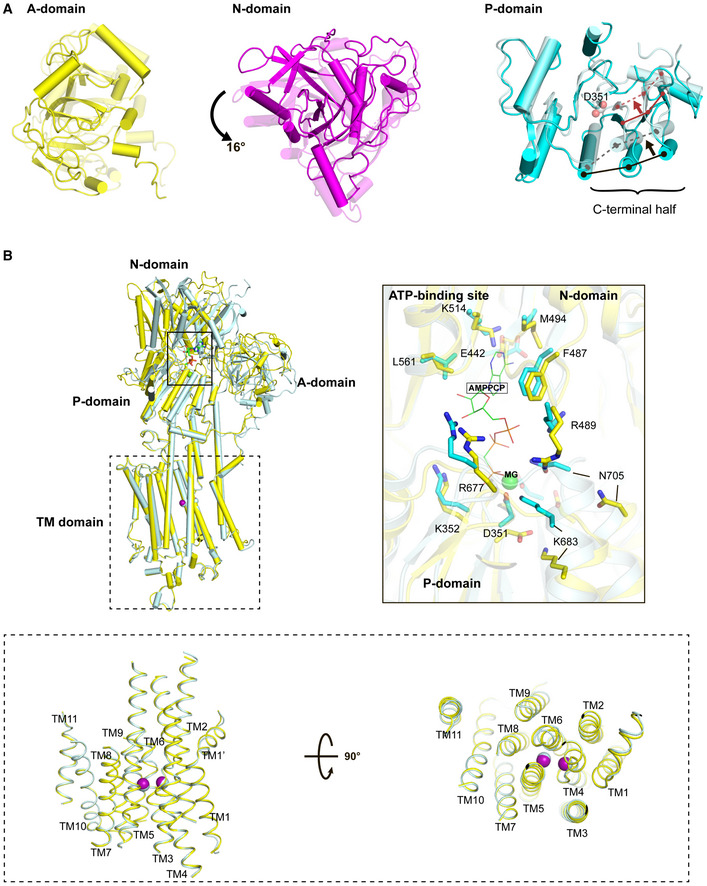
Figure 3. Conformational transition from the closed form of the E1∙2Ca2+ state to the E1∙2Ca2+‐ATP state.

- Top view of the superposition of the A, N, and P domains between E1∙2Ca2+ and E1 ∙2Ca2+‐ATP states, in which all domains and TM helices are shown with transparency 0 (i.e., dense) for the E1∙2Ca2+ state and 0.5 (i.e., faint) for the E1∙2Ca2+‐ATP state. Cryo‐EM structures of SERCA2b in E1∙2Ca2+ and E1∙2Ca2+‐ATP states are superimposed with each other such that the RMSD of all Cα atoms are minimized. The black and red arrows indicate ATP‐induced movements of three β‐strands and three α‐helices contained in the C‐terminal half of the P domain, respectively. The solid and dashed lines indicate the positions of these secondary structure elements before and after ATP binding, respectively. D351 indicated by spheres is a phosphorylation site.
- Superimposition of cryo‐EM structures of SERCA2b in E1∙2Ca2+ (yellow) and E1∙2Ca2+‐ATP (cyan) states, in which TM7−TM10 are aligned with each other. The right inset shows a close‐up view of the ATP‐binding sites of SERCA2b in E1∙2Ca2+ (yellow) and E1∙2Ca2+‐AMPPCP (cyan) states, in which the two structures are superimposed such that the RMSD of their Cα atoms in the N domain is minimized. A Mg2+ ion close to AMPPCP is depicted as a green sphere. The lower inset highlights the side (left) and top (right) views of TM1−TM11 in E1∙2Ca2+ (yellow) and E1∙2Ca2+‐AMPPCP (cyan) states. The purple and cyan spheres indicate two bound Ca2+ ions in the E1∙2Ca2+ and E1∙2Ca2+‐ATP states, respectively.
