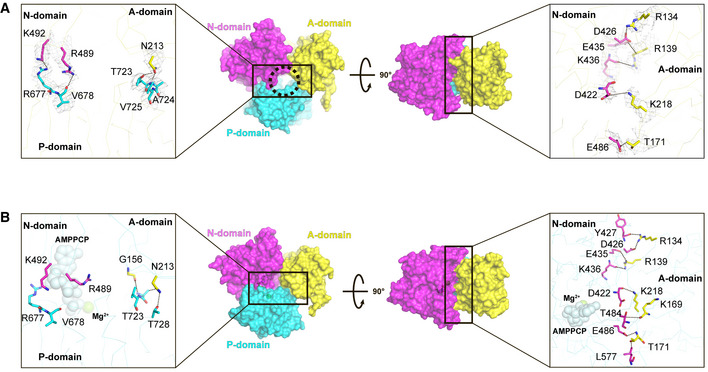
Figure 4. Interface between the A and N domains in E1∙2Ca2+ and E1∙2Ca2+‐AMPPCP states.

- Side (left) and top (right) views of the A, N, and P domains in the cryo‐EM structure of SERCA2b in the E1∙2Ca2+ state represented as a surface model. Residues critical for the domain interactions in the E1∙2Ca2+ state are represented by sticks in the left and right insets. Gray mesh in the inset indicates the density of the resides shown at a contour level of 5.0 σ. The circle in the left panel indicates a cavity that may serve as an ATP entry gate in the “closed‐form” SERCA2b.
- Side (left) and top (right) views of the A, N, and P domains in the cryo‐EM structure of SERCA2b in the E1∙2Ca2+‐AMPPCP state shown in surface model representation. Residues critical for the domain interactions in the E1∙2Ca2+‐AMPPCP state are represented by sticks in the left and right insets. Dotted lines in the right inset indicate hydrogen bonds and salt bridges formed between the residues at the domain interface.
