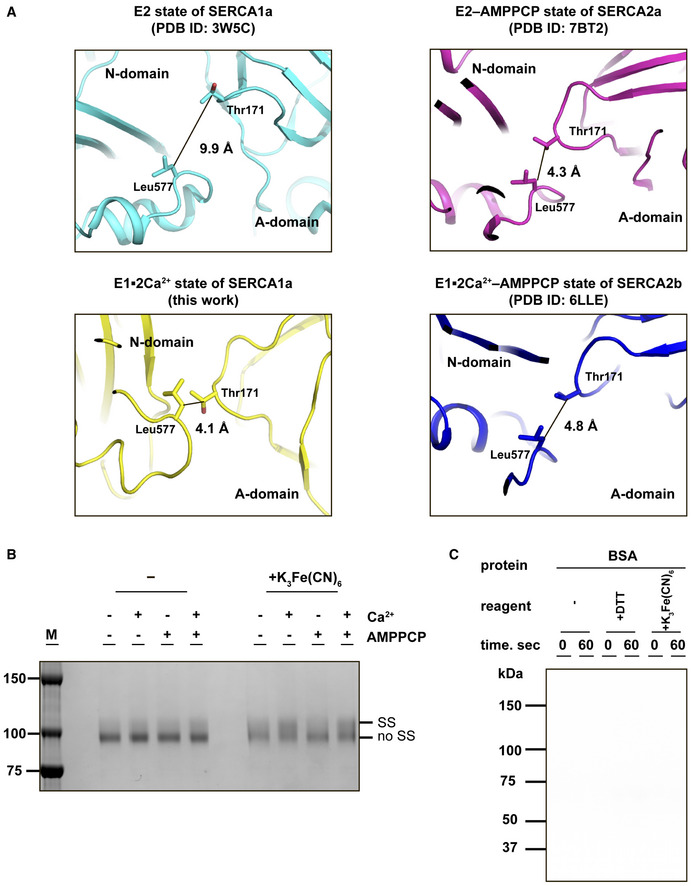
Figure EV4. Effects of Ca2+ and ATP on formation of the closed headpiece cluster of the cytosolic domains, and autophosphorylation assay with BSA.

- Closed‐up view of the interface between the A and N domains in SERCA. The Cβ‐Cβ distance between Thr171 (A domain) and Leu577 (N domain) in the E2 state of SERCA1a (left upper), the E2‐AMPPCP state of SERCA2a (right upper), the E1∙2Ca2+ state of SERCA2b (left lower), or E1∙2Ca2+‐AMPPCP state of SERCA2b (right lower) is shown in each panel.
- SDS–PAGE analysis of purified SERCA2b T171C/L577C (0.5 µg) in the presence or absence of 1 mM Ca2+ and 1.5 mM AMPPCP. Protein bands were visualized by staining with Coomassie Brilliant Blue. “SS” and “no SS” indicate disulfide‐bonded and non‐disulfide‐bonded SERCA2b species, respectively. Note that after oxidative treatment with 5 mM K3Fe(CN)6 for 1hr at pH6.8, the “SS” spices significantly increased in the presence of Ca2+, whereas AMPPCP gave marginal effect on the “SS” spices formation regardless of the presence or absence of Ca2+.
- BSA (40 µg) was used as a negative control in the autophosphorylation assay, and no phosphorylation was observed with this protein. Experimental conditions were the same as those conducted with SERCA2b WT and T171C/L577C.
