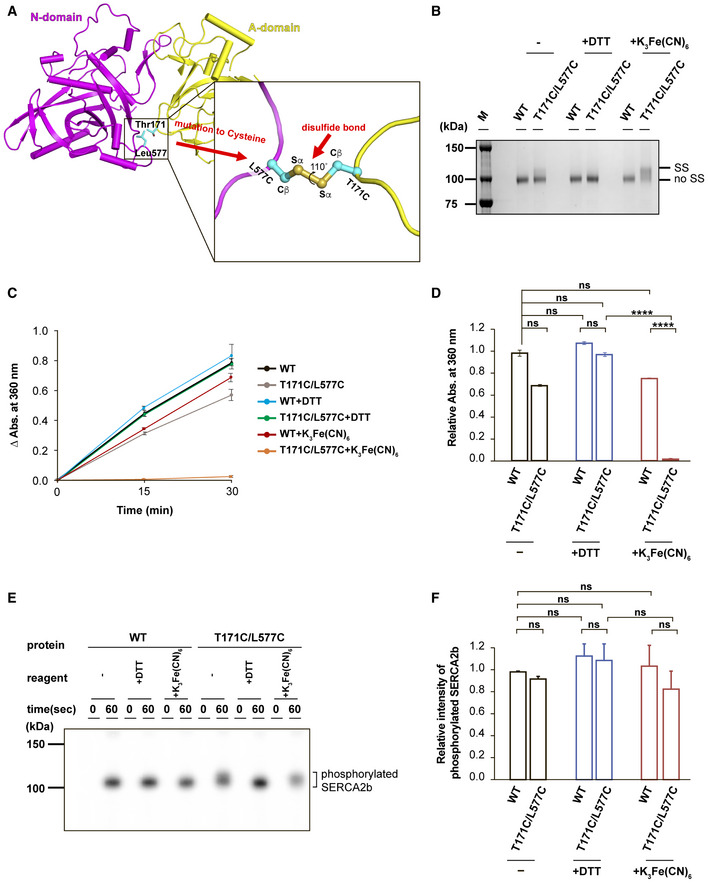
Close‐up view of the interface between the A and N domains. The engineered site in the T171C/L577C mutant is highlighted in the inset.
SDS–PAGE analysis of purified SERCA2b WT and T171C/L577C (0.5 µg each) after treatment with no reagent (−), 10 mM DTT, or 5 mM K3Fe(CN)6 at pH 7.0. Protein bands were visualized by staining with Coomassie Brilliant Blue. Note that T171C/L577C displayed a slower electrophoretic mobility than WT but displayed similar migration in the presence of DTT. “SS” and “no SS” indicate disulfide‐bonded and non‐disulfide‐bonded SERCA2b species, respectively.
ATPase activity of SERCA2b WT and T171C/L577C without reagents (−), or in the presence of DTT or K3Fe(CN)6. Results are means ± SD of three independent experiments.
Bar graphs showing the relative ATPase activity of SERCA2b WT and T171C/L577C under the indicated conditions. Results are means ± standard deviation (SD) of three independent experiments. Relative absorbance at 360 nm is normalized with the absorbance of WT without reagents (−), and statistical significance is calculated by one‐way ANOVA followed by Tukey's test. (ns, not significant; ****P < 0.0001).
Autophosphorylation assays of SERCA2b WT and T171C/L577C without reagents (−), or in the presence of 10 mM DTT (+DTT) or 5 mM K3Fe(CN)6 (+K3Fe(CN)6). Protein bands were visualized by detecting 32Pi with a Phosphorimager.
Bar graphs showing the relative band intensity of 32Pi‐conjugated SERCA2b WT and T171C/L577C under the indicated conditions. Results are means ± SD of three independent experiments. Relative band intensity is normalized with the intensity of phosphorylated SERCA2b WT without reagents (−), and statistical significance is calculated by one‐way ANOVA followed by Tukey's test (ns, not significant).

