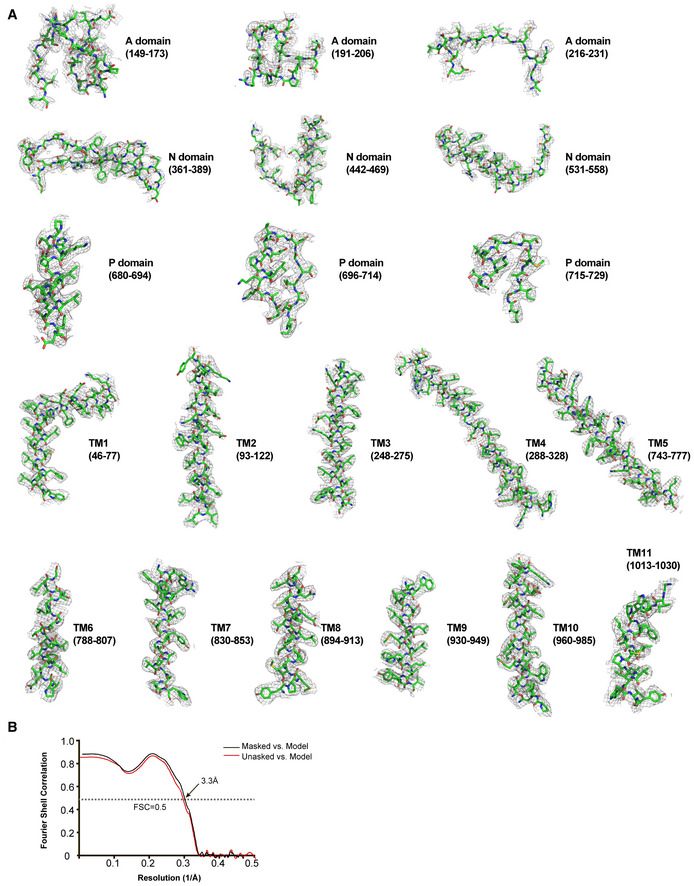
Figure EV5. Representative densities and Cross‐validation FSC curves for map‐to‐model.

- Representative densities of the A, N, and P cytosolic domains and TM helices in the present cryo‐EM map of SERCA2b in the E1∙2Ca2+ state. Segments are indicated by the residue number in parentheses. All densities are shown at a contour level of 5.0 σ.
- Cross‐validation FSC curves for map‐to‐model fitting of SERCA2b WT in the E1∙2Ca2+ state.
