Fig. 6.
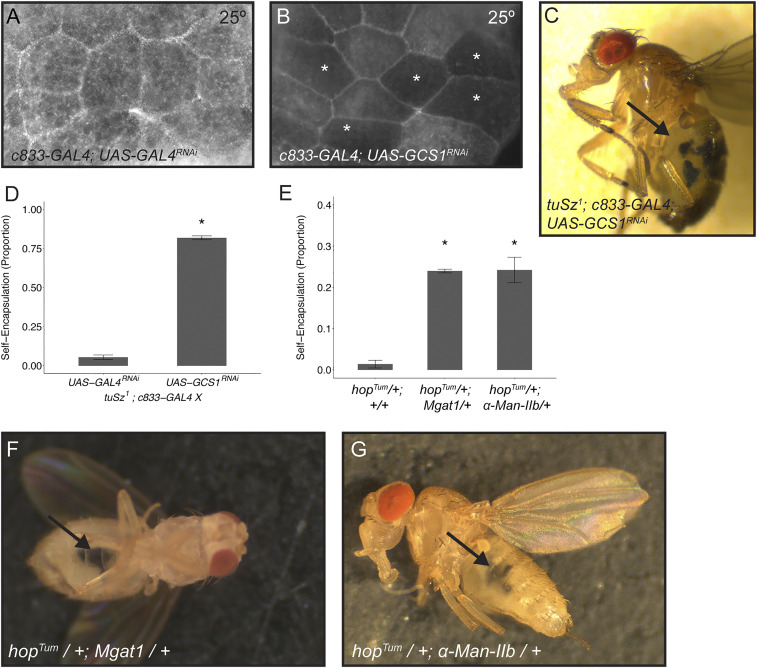
Loss of GCS1 leads to loss of self-tolerance. (A and B) Posterior fat body tissue dissected from larvae raised at 25 °C and stained with FITC-WGA to assay protein N-glycosylation. Control c833-GAL4; UAS-GAL4RNAi tissue is positive for FITC-WGA staining (A). c833-GAL4; UAS-GCS1RNAi shows a mosaic loss of FITC-WGA staining, where * marks fat body cells with decreased staining (B). (C) tuSz1; c833-GAL4; UAS-GCS1RNAi flies raised at 25 °C show melanized self-encapsulations (indicated by the arrow). (D) Penetrance of the self-encapsulation phenotype in control tuSz1; c833-GAL4; UAS-GAL4RNAi and tuSz1; c833-GAL4; UAS-GCS1RNAi flies raised at 25 °C. *P < 0.05 compared to tuSz1; c833-GAL4; UAS-GAL4RNAi. (E) Penetrance of the self-encapsulation phenotype in hopTum/+, hopTum/+; Mgat1KG02444/+, and hopTum/+; α-Man-IIbMI09613/+ flies raised at 28 °C. *P < 0.05 compared to hopTum/+. (F) hopTum/+; Mgat1KG02444/+ flies raised at 28 °C show melanized self-encapsulations (indicated by the arrow). (G) hopTum/+; α-Man-IIbMI09613/+ flies raised at 28 °C show melanized self-encapsulations (indicated by the arrow). P values (D and E) were determined by generalized linear models.

