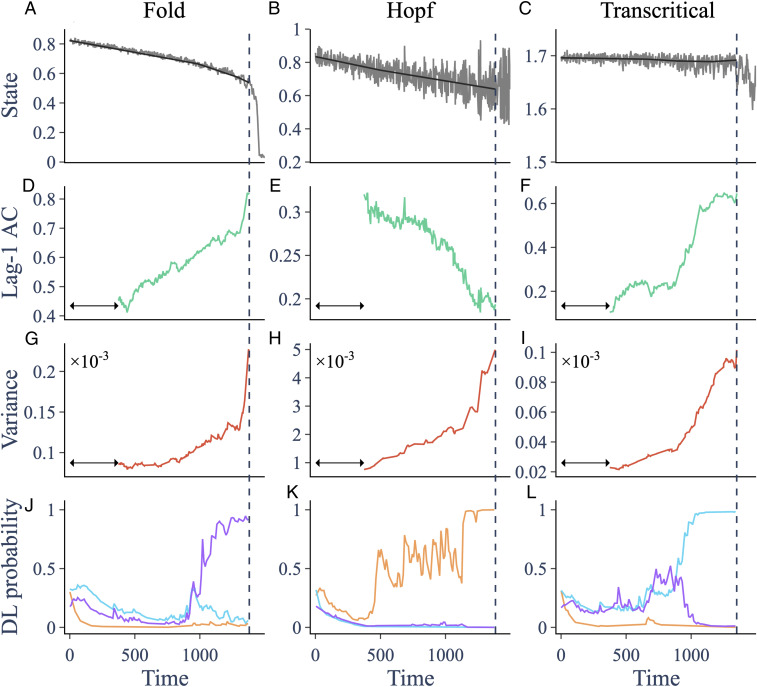
Fig. 1.
Trends in indicators prior to three different bifurcations in ecological models. (A–C) Trajectory (gray) and smoothing (black) of a simulation of an ecological model going through a fold, Hopf, and transcritical bifurcation, respectively. (D–F) Lag-1 AC computed over a rolling window (arrow) of width 0.25. (G–I) Variance. (J–L) Probabilities assigned to the fold (purple), Hopf (orange), and transcritical (cyan) bifurcation by the DL algorithm. The vertical dashed line marks the time at which the system crosses the bifurcation.

