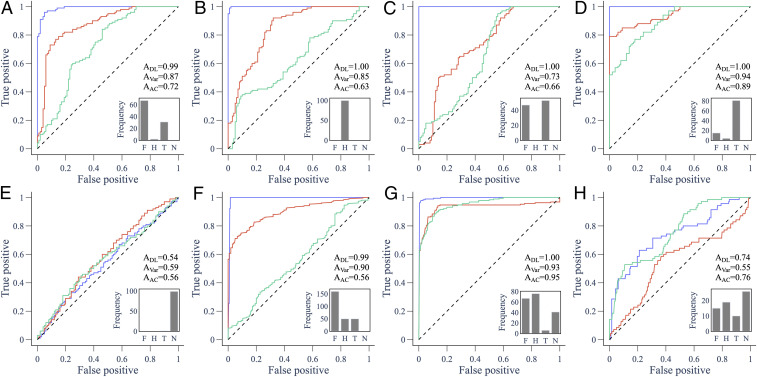
Fig. 2.
ROC curves for predictions using 80 to 100% of the pretransition time series for model and empirical data. ROC curves compare the performance of the DL algorithm (blue), variance (red), and lag-1 AC (green) in predicting an upcoming transition. The area under the curve (AUC), abbreviated to A, is a measure of performance. Insets show the frequency of the favored DL probability among the forced trajectories: (F)old, (T)ranscritical, (H)opf, or (N)eutral. (A) May’s harvesting model going through a fold bifurcation; (B and C) consumer−resource model going through a (B) Hopf and (C) transcritical bifurcation; (D and E) behavior−disease model going through a transcritical bifurcation using data from (D) provaccine opinion () and (E) total infectious (); (F) sediment data showing rapid transitions to an anoxic states in the Mediterranean sea; (G) data of a thermoacoustic system undergoing a Hopf bifurcation; and (H) ice core records showing rapid transitions in paleoclimate data. The diagonal dashed line marks where a classifier works no better than a random coin toss.

