Fig. 1.
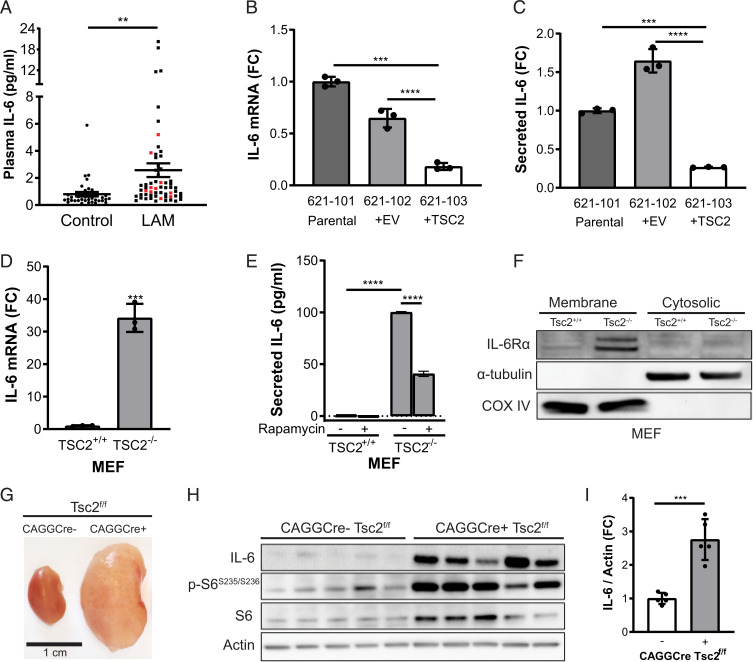
IL-6 is overexpressed in TSC2-deficient cells and tissues. (A) IL-6 was increased in the plasma of LAM patients (total n = 60, black dots: sporadic LAM, n = 50; red dots: TSC-LAM, n = 10) compared to healthy controls (n = 38). The data are presented as the mean ± SEM. (B) IL-6 mRNA expression by qRT-PCR and (C) secreted IL-6 measured by ELISA are increased in TSC2-deficient human angiomyolipoma parental cells (621-101) and cells expressing empty vector (621-102) compared to cells with TSC2 addback (621-103). (D) qRT-PCR of IL-6 mRNA expression showing a 30-fold increase in Tsc2−/− MEFs compared to Tsc2+/+ MEFs. (E) Rapamycin treatment decreases secreted IL-6 in TSC2-deficient MEFs as measured by ELISA (rapamycin; 20 nM, 24 h). (F) Western blot of membrane and cytosolic protein fractions of TSC2-deficient and wild-type MEFs. IL-6Rα is highly expressed in TSC2-deficient MEFs compared to TSC2-expressing MEFs. Cells were cultured in serum-free DMEM for 24 h before harvesting. α-tubulin used as a cytosolic fraction marker and COX IV as a membrane fraction marker. (G) Representative kidneys of CAGGCre-ERTM+/−; Tsc2f/f and CAGGCre-ERTM−/−; Tsc2f/f mice. (H) Western blot of CAGGCre-ERTM+/−; Tsc2f/f and CAGGCre-ERTM−/−; Tsc2f/f kidneys showing increased IL-6 expression upon TSC2 loss. (I) Densitometry of IL-6 protein levels normalized to actin in CAGGCre-ERTM+/−; Tsc2f/f and CAGGCre-ERTM−/−; Tsc2f/f kidney lysates shown in H. Data are presented as the mean ± SD of three independent experiments, unless indicated otherwise. One-way ANOVA, two-way ANOVA, or Student’s t test were used for statistical analysis. **P < 0.01, ***P < 0.001, ****P < 0.0001.

