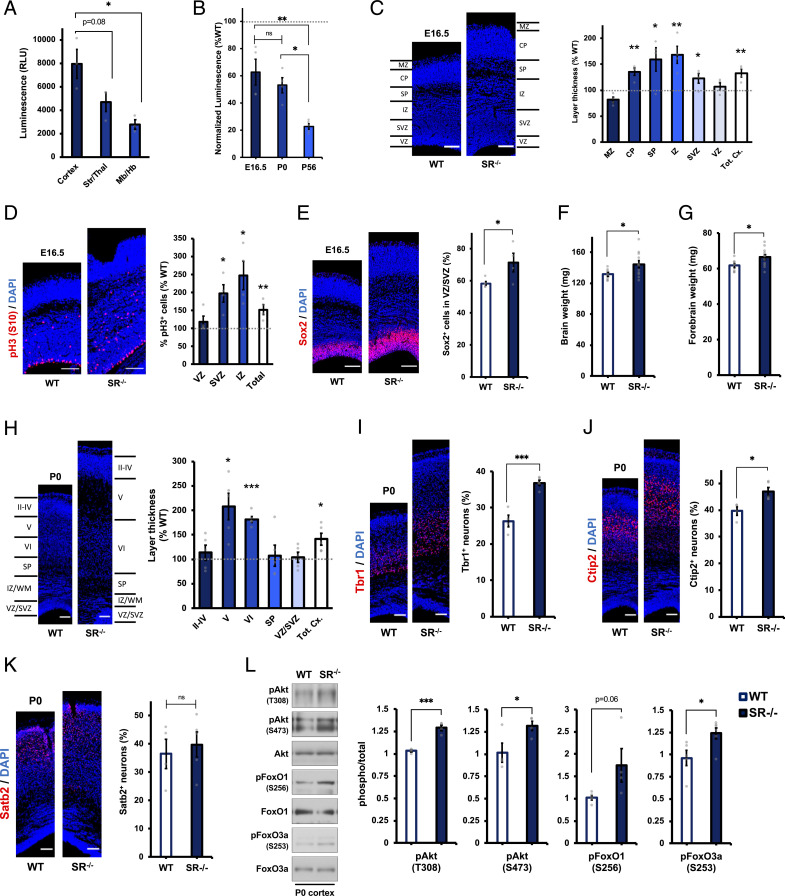
Fig. 4.
Aberrant cortical architecture in embryonic and neonatal SR−/− mice. (A) Luciferase measurements of d-cys levels in lysates from cortex, striatum/thalamus (Str/Thal), or midbrain/hindbrain (Mb/Hb) of P0 wild-type (WT) mice (n = 3). (B) Luciferase measurements of d-cys levels in SR−/− mouse brain lysates at the indicated ages. Data are normalized to luciferase measurements in age-matched wild-type controls (n = 4 to 5). (C) Representative DAPI staining and quantification of cortical zone thickness in coronal cortical sections from E16.5 WT and SR−/− mice. Layer thicknesses in SR−/− mice are normalized to the mean thickness of the corresponding layer in WT mice (n = 4 to 5). MZ, marginal zone; CP, cortical plate; SP, subplate; IZ, intermediate zone, SVZ, subventricular zone; VZ, ventricular zone; and Tot. Cx., total cortical thickness. (D) Immunostaining for phosphohistone H3 (pH3, S10) and DAPI in E16.5 WT and SR−/− cortical sections. Data are expressed as the ratio of pH3+ cells to total (DAPI+) cells in the indicated layer of SR−/− mice, normalized to WT controls (n = 4). (E) Immunostaining for Sox2 and DAPI in E16.5 WT and SR−/− cortical sections. Data are expressed as the ratio of Sox2+ cells to total (DAPI+) cells in the VZ/SVZ (n = 4 to 5). (F and G) Weight of (F) whole brains and (G) forebrains of P0 WT and SR−/− mice (n = 8 to 11). (H) Representative DAPI staining and quantification of cortical layer thickness in P0 WT and SR−/− mice, quantified as in C (n = 4 to 5). (I–K) Immunostaining for (I) Tbr1, (J) Ctip2, (K) Satb2, and DAPI in P0 WT and SR−/− cortical sections. Data are quantified as the ratio of marker-positive cells to the total number of (DAPI+) cells (n = 4 to 5). (L) Representative immunoblots and quantification of phospho- and total Akt, FoxO1, and FoxO3a in cortical lysates from P0 WT and SR−/− mice. Data are expressed as the normalized ratio of phosphorylated to total protein (n = 5). (Scale bars, 100 µm.) Data are graphed as mean ± SEM *P < 0.05, **P < 0.01, ***P < 0.001, ns = P > 0.05, ANOVA with post hoc Tukey’s test (A and B) or two-tailed unpaired Student’s t test (C–L).

