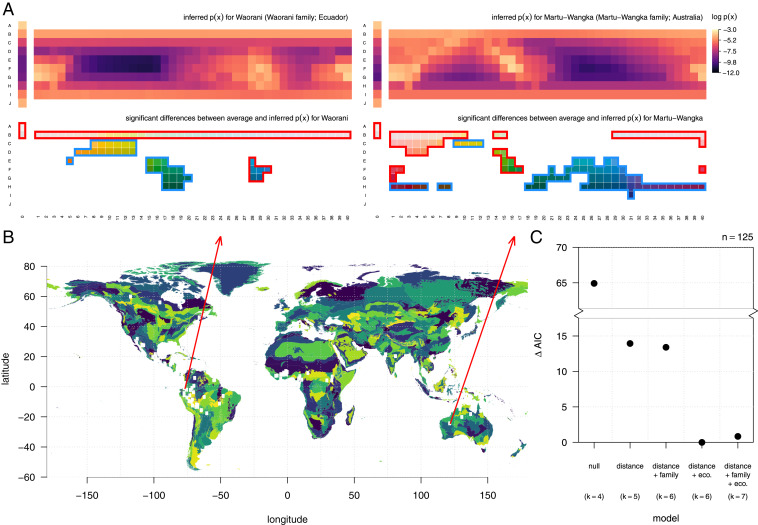
Fig. 5.
The communicative needs of colors vary across languages, and they are correlated with geographic location and ecological region. (A) The inferred distribution of communicative needs for two example languages (Top). For each language, many color chips have significantly elevated (red border) or suppressed (blue border) communicative need compared to the across-language average (Bottom; deviations that exceed with 95% confidence are highlighted in red or blue). (B) The approximate locations of WCS native language communities (red points) shown on a world map colored by ecoregions (47). (C) Languages spoken in closer proximity to each other and sharing the same ecoregion tend to have more similar inferred communicative needs (type II Wald χ2 tests; 20.98, df = 1, ; and 12.91, df = 1, ), whereas shared language family does not have a significant effect ( 1.022, df = 1, ). Distance and shared ecoregion each substantially improve the fit of GLMMs predicting the distance between pairs of inferred communicative needs. GLMMs were fit using log-normal link function and a random effects model designed for regression on distance matrices (69) (see Correlates of Cross-Cultural Differences in Communicative Need); denotes the total number of fixed and random effects in each model.

