Fig. 3.
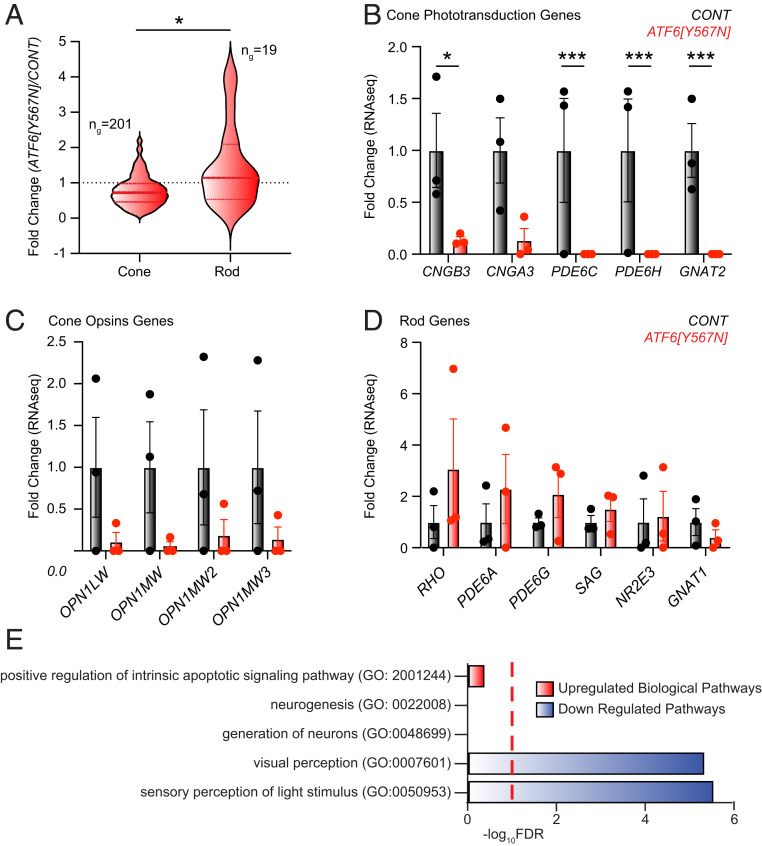
Cone visual pigments and cone phototransduction gene expression are severely reduced in ACHM patient retinal organoids. (A) RNA-seq profiling reveals significant loss of cone photoreceptor transcripts in ACHM retinal organoids compared to control retinal organoids. Violin plots show expression levels of 201 cone photoreceptor genes and 19 rod photoreceptor genes identified by RNA-seq in ATF6[Y567N] ACHM retinal organoids, normalized to control retinal organoids. The thick, dashed horizontal line marks the median level of gene expression, and the thin horizontal lines delimit the upper and lower quartiles of genes in each violin plot. Cone- and rod-specific genes were defined in ref. 19. The complete gene sets are shown in Dataset S2. *P < 0.05 by Welch’s t test, t = 2.590. (B–D) Fold change of cone phototransduction gene transcripts (B), cone opsin (visual pigment) gene transcripts (C), and rod phototransduction gene transcripts (D) measured by RNA-seq from normal vision patient retinal organoids (gray bars) and ATF6[Y567N] ACHM patient retinal organoids (red bars). Individual replicates are shown, and error bars show mean ± SEM. ***P < 0.005, *P < 0.05 measured from DESEQ analysis (Dataset S1). (E) GO analysis identifies up-regulated (red) and down-regulated (blue) biological processes in RNA-seq transcriptional datasets from ATF6[Y567N] ACHM retinal organoids compared to control. Red dashed line indicates FDR = 0.1. The complete GO analysis is shown in Dataset S3.

