Fig. 2.
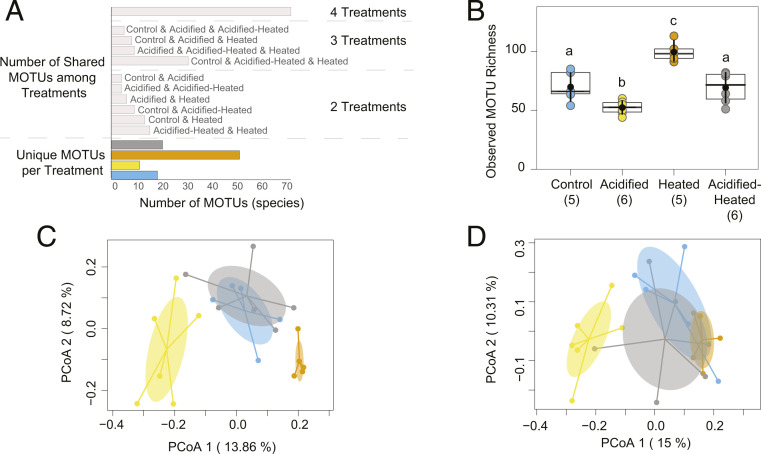
Species richness represented by shared, unique, and overall MOTUs per treatment and treatment communities visualized through principal coordinate analysis (PCoA). (A) MOTU distribution (n = 275) based on the number of shared MOTUs among treatments as well as the number of unique MOTUs per treatment. (B) Observed MOTU richness by treatment. Black dots represent mean richness, the crosshatch is the median, box limits are upper and lower quartiles, and the vertical lines through the mean represent one SD above and below the mean. Parentheses represent the number of ARMS units within each treatment. Lowercase letters denote significant differences among treatments at alpha = 0.05 based on Tukey post hoc results. (C) PCoA on community composition (present/absent—Jaccard dissimilarity index) and (D) PCoA on community structure (relative abundance—Bray–Curtis dissimilarity index). Ellipses are colored by treatment and based on the 95% confidence limit of the SEM for each group. Colored dots represent ARMS units within treatments. Treatments are colored as follows: Control, blue; Acidified, yellow; Heated, orange; and Acidified-Heated, gray.

